Thryv · Data visualization
Chart Library
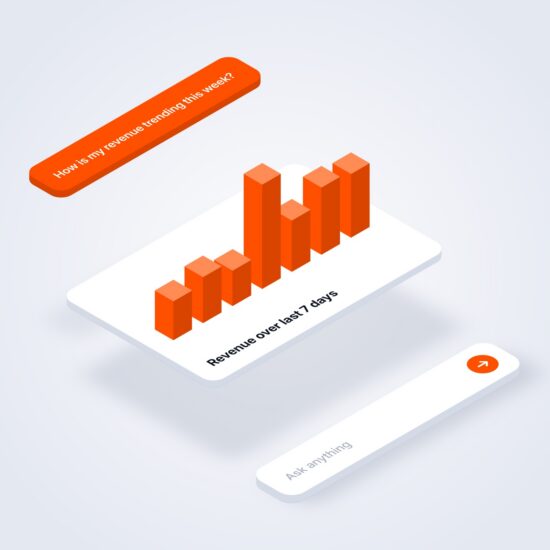
18 chart types and 64 variants, all drawn by one component.
I designed this chart library by hand in Figma first, then built it in Claude Code. It drew the charts in my Ask Thryv and SMB Reporting prototypes and gave engineering code for every chart.
- Role
- Lead Product DesignerFigma spec to working code
- Timeline
- May to Aug 2026Grew out of Ask Thryv's April charts
- Built with
- Figma, then Claude CodeReact and ECharts
- Used in
- Ask Thryv and SMB ReportingBoth Ask rounds, all three SMB versions
I kept building the same charts for these prototypes, so I turned them into a shared chart library. Other designers pulled it into their own prototypes, and engineering used it for Ask Thryv instead of the outdated charts.
Which chart fits
I worked out the rules in Figma first.
I made stacked bars the default for part of a whole and kept donuts for a few slices. Each chart had to pass the four questions at the bottom.
Color hierarchy
A new series always takes the next color.
I fixed the order so the same data keeps its color from chart to chart. Green and red are kept for up and down, never for a series.
Stacked columns take up to four series.
Donuts take up to seven slices, best kept to five.
Types and variants
One component draws every chart.
A type prop picks the chart, and a stacked column is the same component with one more prop.
chart types, from Line to Calendar
variants, each one set by props
component that draws all of them
Variants, each one a prop
Rules engineering could follow
Every chart follows the same rules.
I wrote the rules as numbers engineering could check, and the component applies them on its own.
- 1At most six ticks
Steps snap to round numbers like 1, 2, 2.5, 5 or 10, and the axis starts at zero.
- 2Compact currency
Axis labels read $50K or $1.5M, never $50,000.
- 3Date labels at least 60px apart
The first and last labels pin to the edges, and inner labels drop out before they collide.
- 4Dotted gridlines
1px, 5 on and 5 off, black at 9%, to match the Figma spec.
mini hides the axes, gridlines and tooltips for small spaces. Drag the edge above to resize the chart, and point at it to see its hover state.
Motion, specified
Every entrance runs on set timings.
I set the timings once in the library, so a chart moves the same way in any prototype that uses it. A resize never cuts an entrance short.
Handoff
Engineering got code for every chart.
I built the panels so engineers could copy just the parts they needed. I also wrote a Dev Guide and a drop-in handoff bundle with a README.
Engineering used my repo as the working reference and pulled code snippets from it.
Where it was used
The same charts in both projects.
Ask Thryv and SMB Reporting passed their own data to one component, so their charts share its axes, motion and hover states.
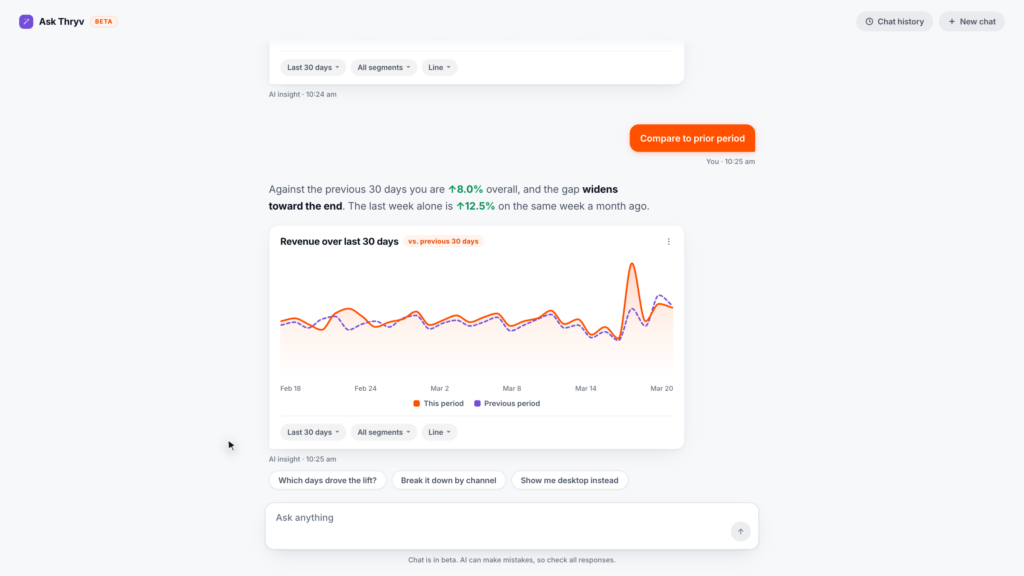
Ask Thryv
Owners ask about their business in plain words. Answers come with a chart they can switch to another type.
 Read the case study
AI reporting dashboards
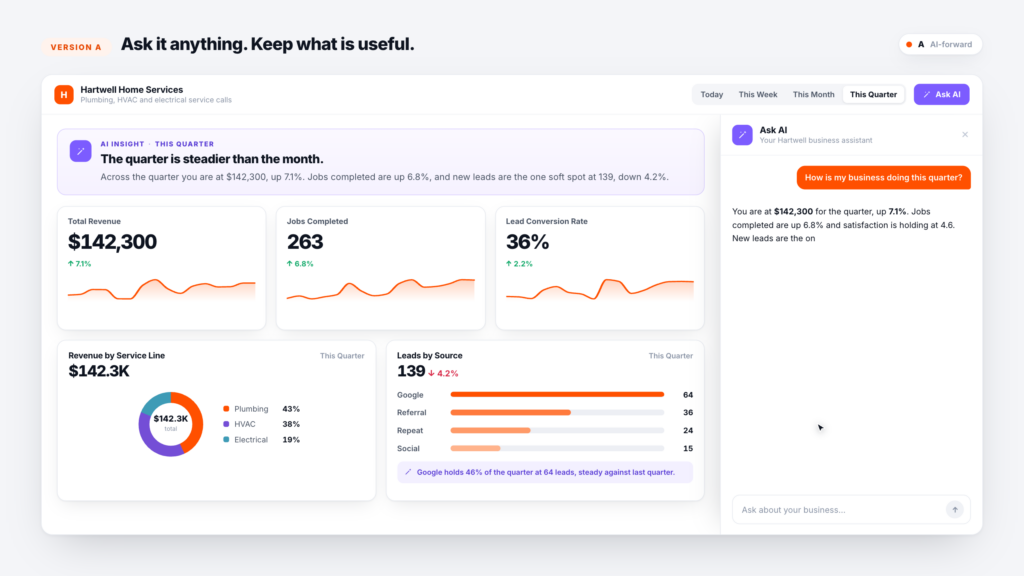
SMB Reporting
Three versions of a reporting dashboard, tested with 53 small business owners. All three versions used one shared copy of the library.
 Read the case study
<ChartRenderer type="Line" data={revenue} dates={dates} compare prevData={lastPeriod} />- Building. I built the component, its gallery and the Dev Reference panels in Claude Code.
- Checking. With Claude Code I cleared every lint error and added 47 tests over the axis math, formats and search before the handoff.
- Handoff. The README tells engineers who use Claude to point it at the README and the component.
I worked out which chart fits which question, the color ramps and the chart specs by hand in Figma first. Claude Code let me turn them into working, tested code far faster than I could alone.