New in round two
Saying what it couldn't answer built trust.
In round two I asked people to trigger an error on purpose.
Most said the reply helped.
What people valued
- Said plainly what it didn't have
- Explained why
- Offered alternatives to try


Thryv · Conversational AI case study
Ask how your business is doing, and get the answer and the why.
Thryv's small business owners had to click through dashboards and reports to see how the business was doing. I designed Ask Thryv so they can ask in plain words, built both prototypes in Claude Code and led both rounds of testing. Round two scored 82.4 for usability, and I handed it off to engineering for a beta.
The problem
They opened a dashboard, hunted for the right widget and worked out the why on their own. In round one, 7 of 9 people checked their data daily. Ask Thryv, the first AI feature a Thryv product team added, started as AI insights on each reporting page. Users responded well, but a new metric only reached owners once a whole report around it was built. So the business turned to an AI chat, where owners could ask for any single metric. Another team had started one, and my team ended up taking over with a focus on reporting.
So it gives you insights by asking questions instead of waiting for the report.
My role: Lead Product Designer, working with a PM. I owned the discovery research, the interaction design, both prototypes and round two's AI service, and the test plan, script and final report. Our lead researcher helped run round one from my test plan, and I ran round two on my own. The PM wrote the original epic. I created design tasks for work outside its scope, handed the prototype and its repo to engineering and stayed on for redlines.
Ask Thryv started first. My SMB Reporting study ran alongside it, and one of its three versions reused Ask Thryv's chat logic. It finished before Ask Thryv's beta.
The 30-second read
Round one's keyword rules couldn't keep up with how people asked.
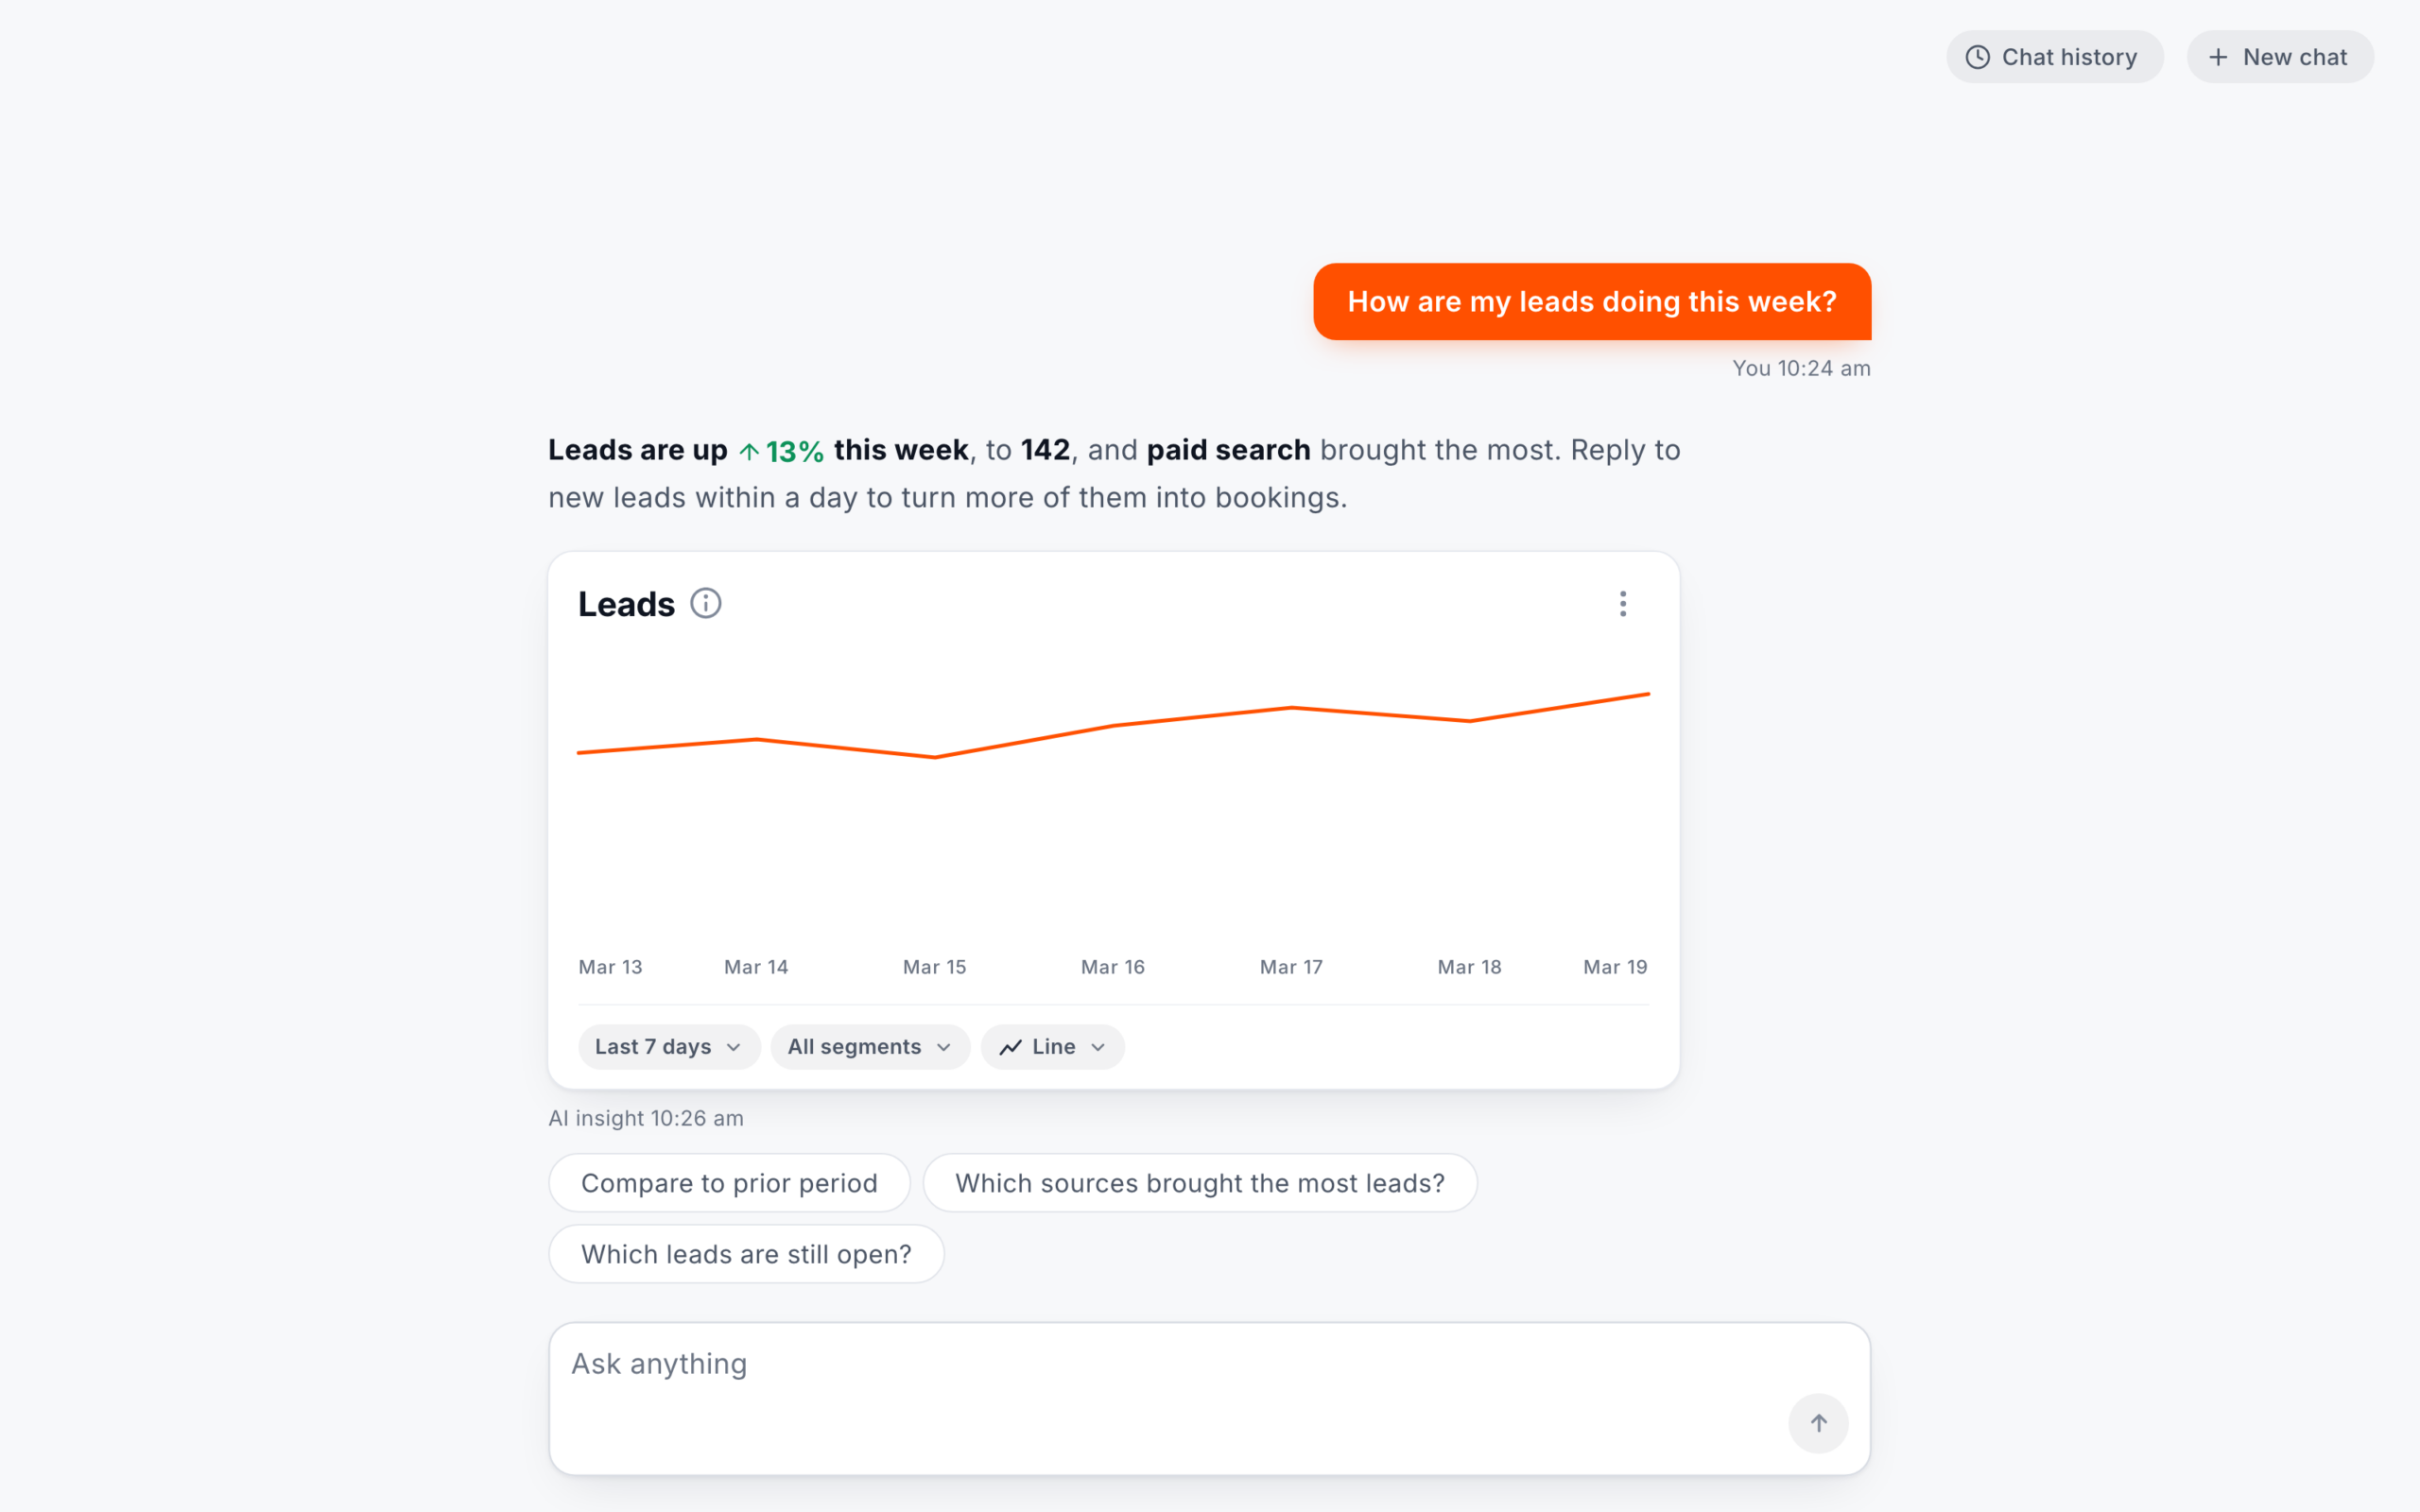
Each answer says what the numbers mean and what to do about it, with chips for a follow-up. I designed it, built both prototypes in Claude Code and led both rounds of testing.See how it reads a question
For round two I named the timeframe on comparisons and had a real LLM write the answers and chips. Then I handed it off to engineering for a beta with Thryv users.
Controls update the card in place, and each question gets a new reply.
Discovery and the first design
Research and Thryv's own widgets disagreed on where the controls go.
Round one
Both versions ran the same 5 leads tasks. I wanted to see whether people knew what to do with a chat box, and whether they tapped a control or typed.
Early research suggested people would want controls near the chat box, where most tapping happens, so A put them below the chart and B kept them above, as on Thryv's dashboard widgets. Ease was within 0.33 on every task, and most people preferred controls below.
Version A
Controls below
Kept in round two
Version B
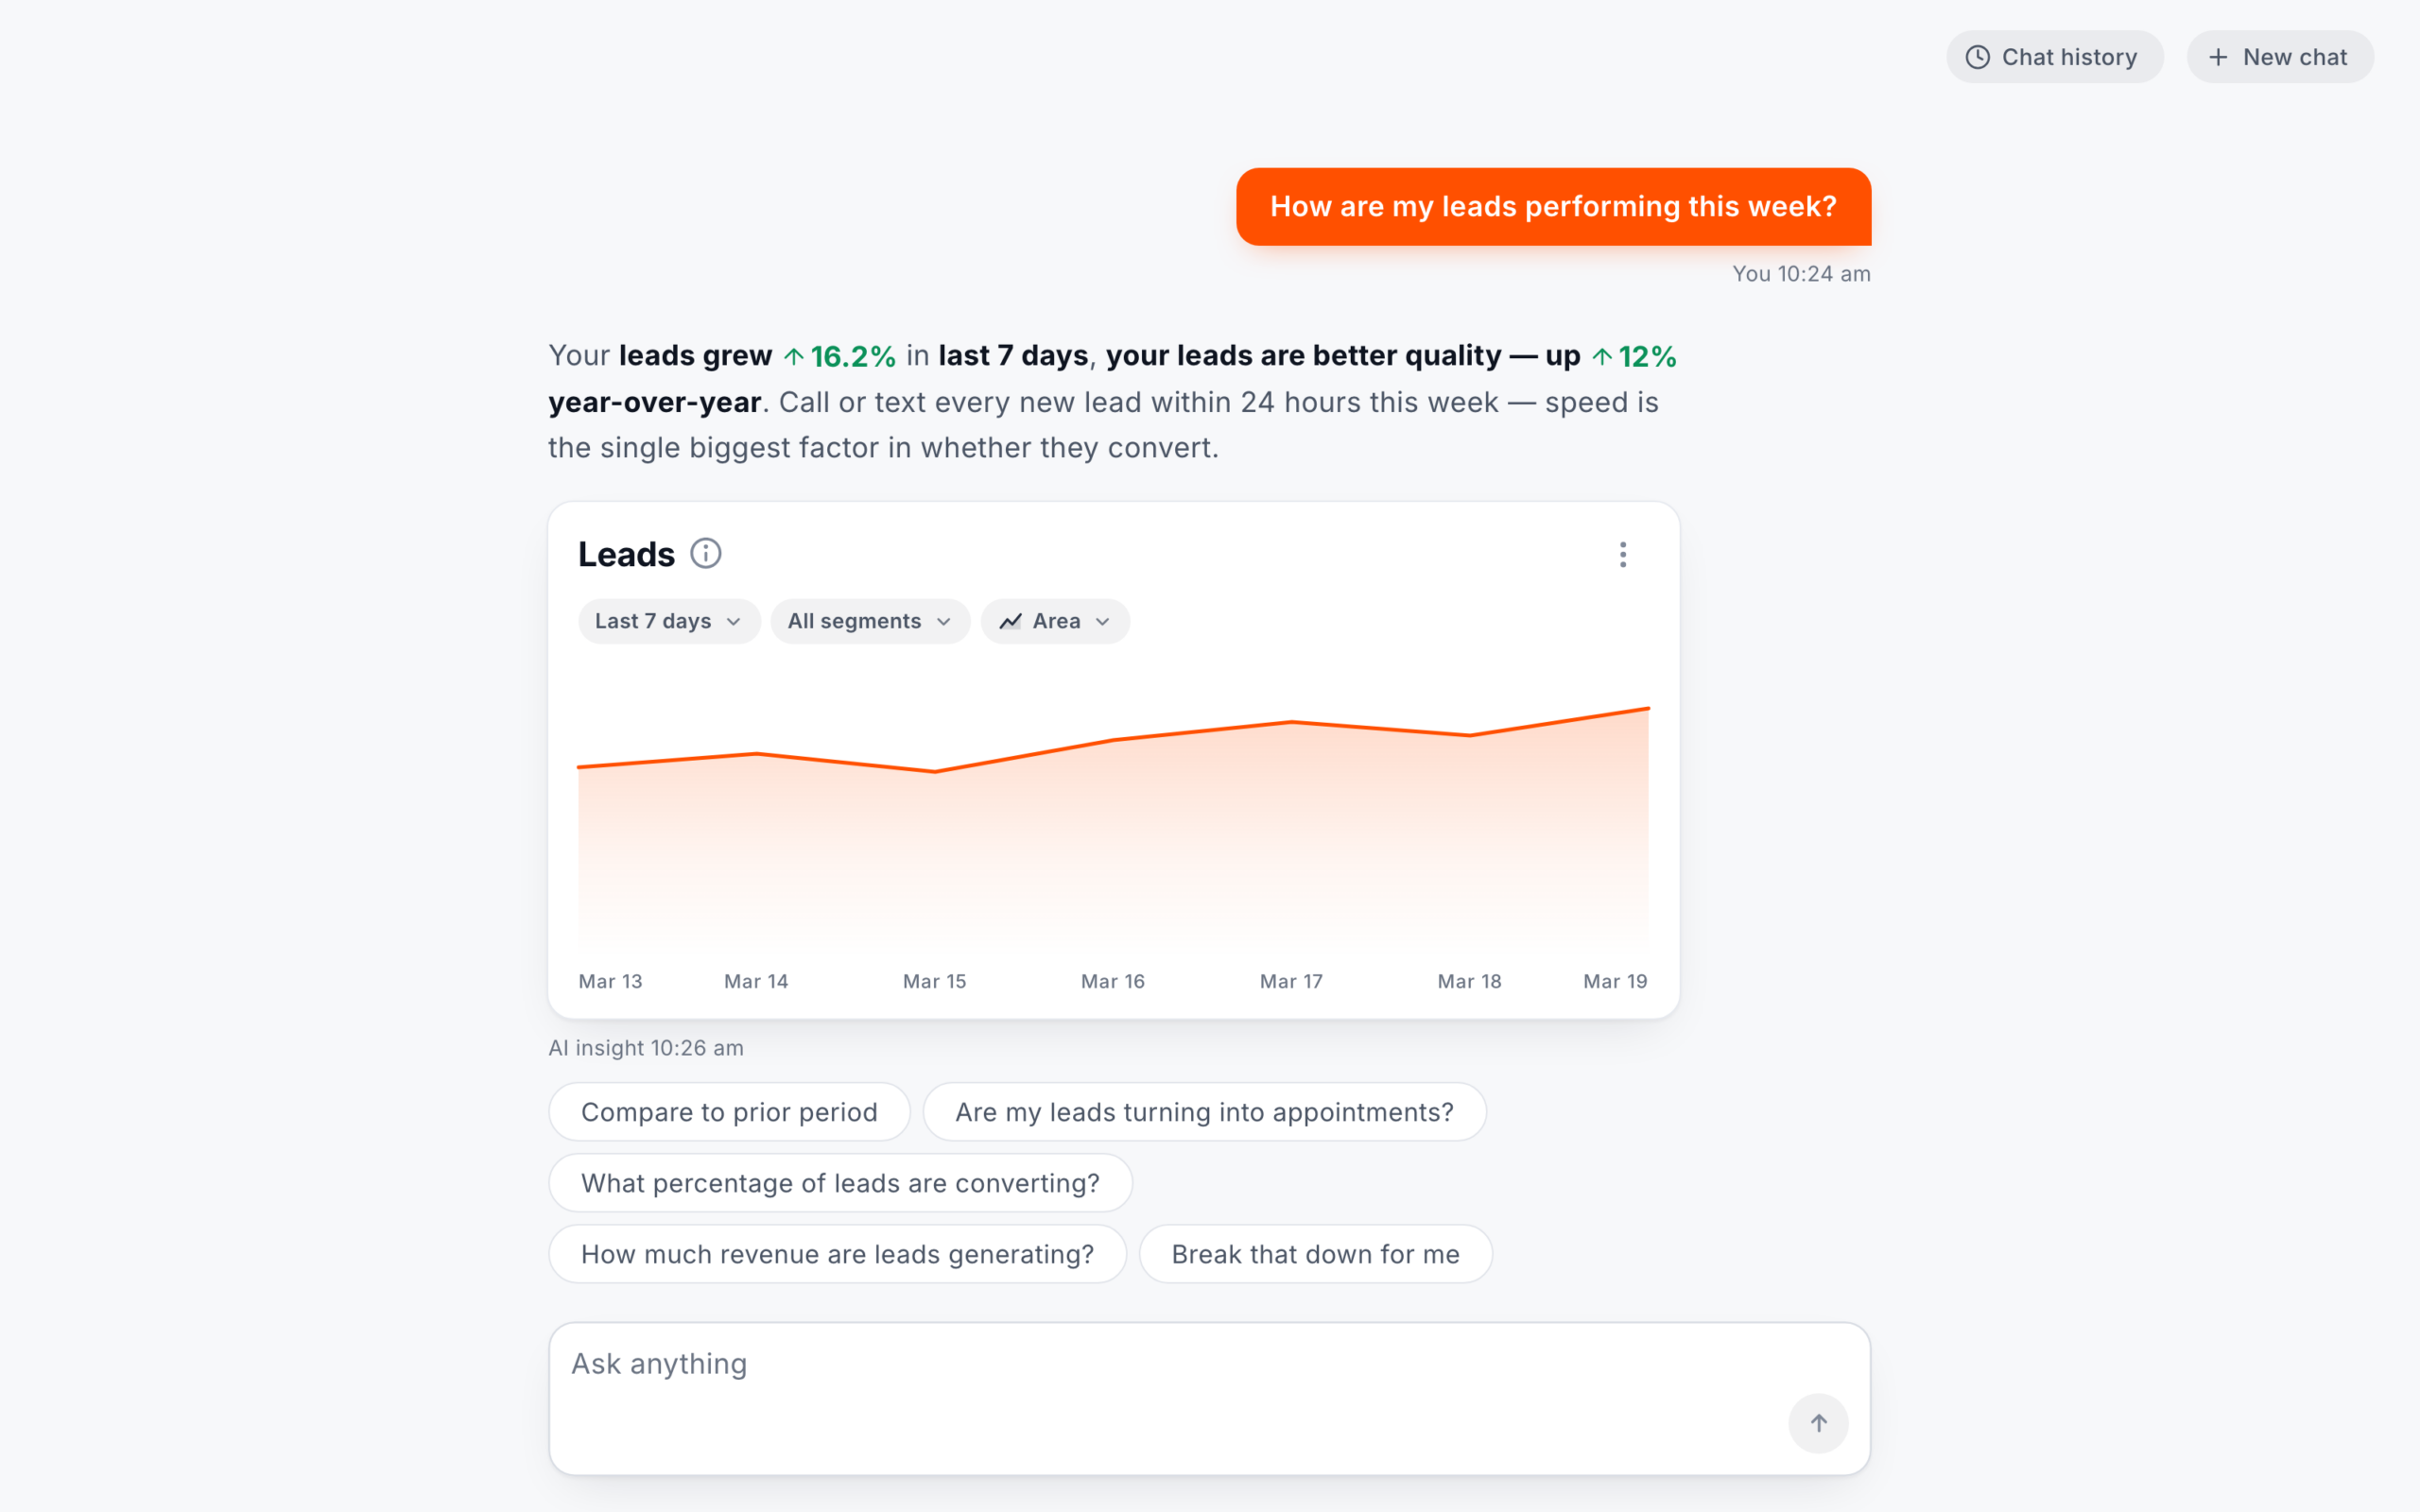
Controls above
Version A
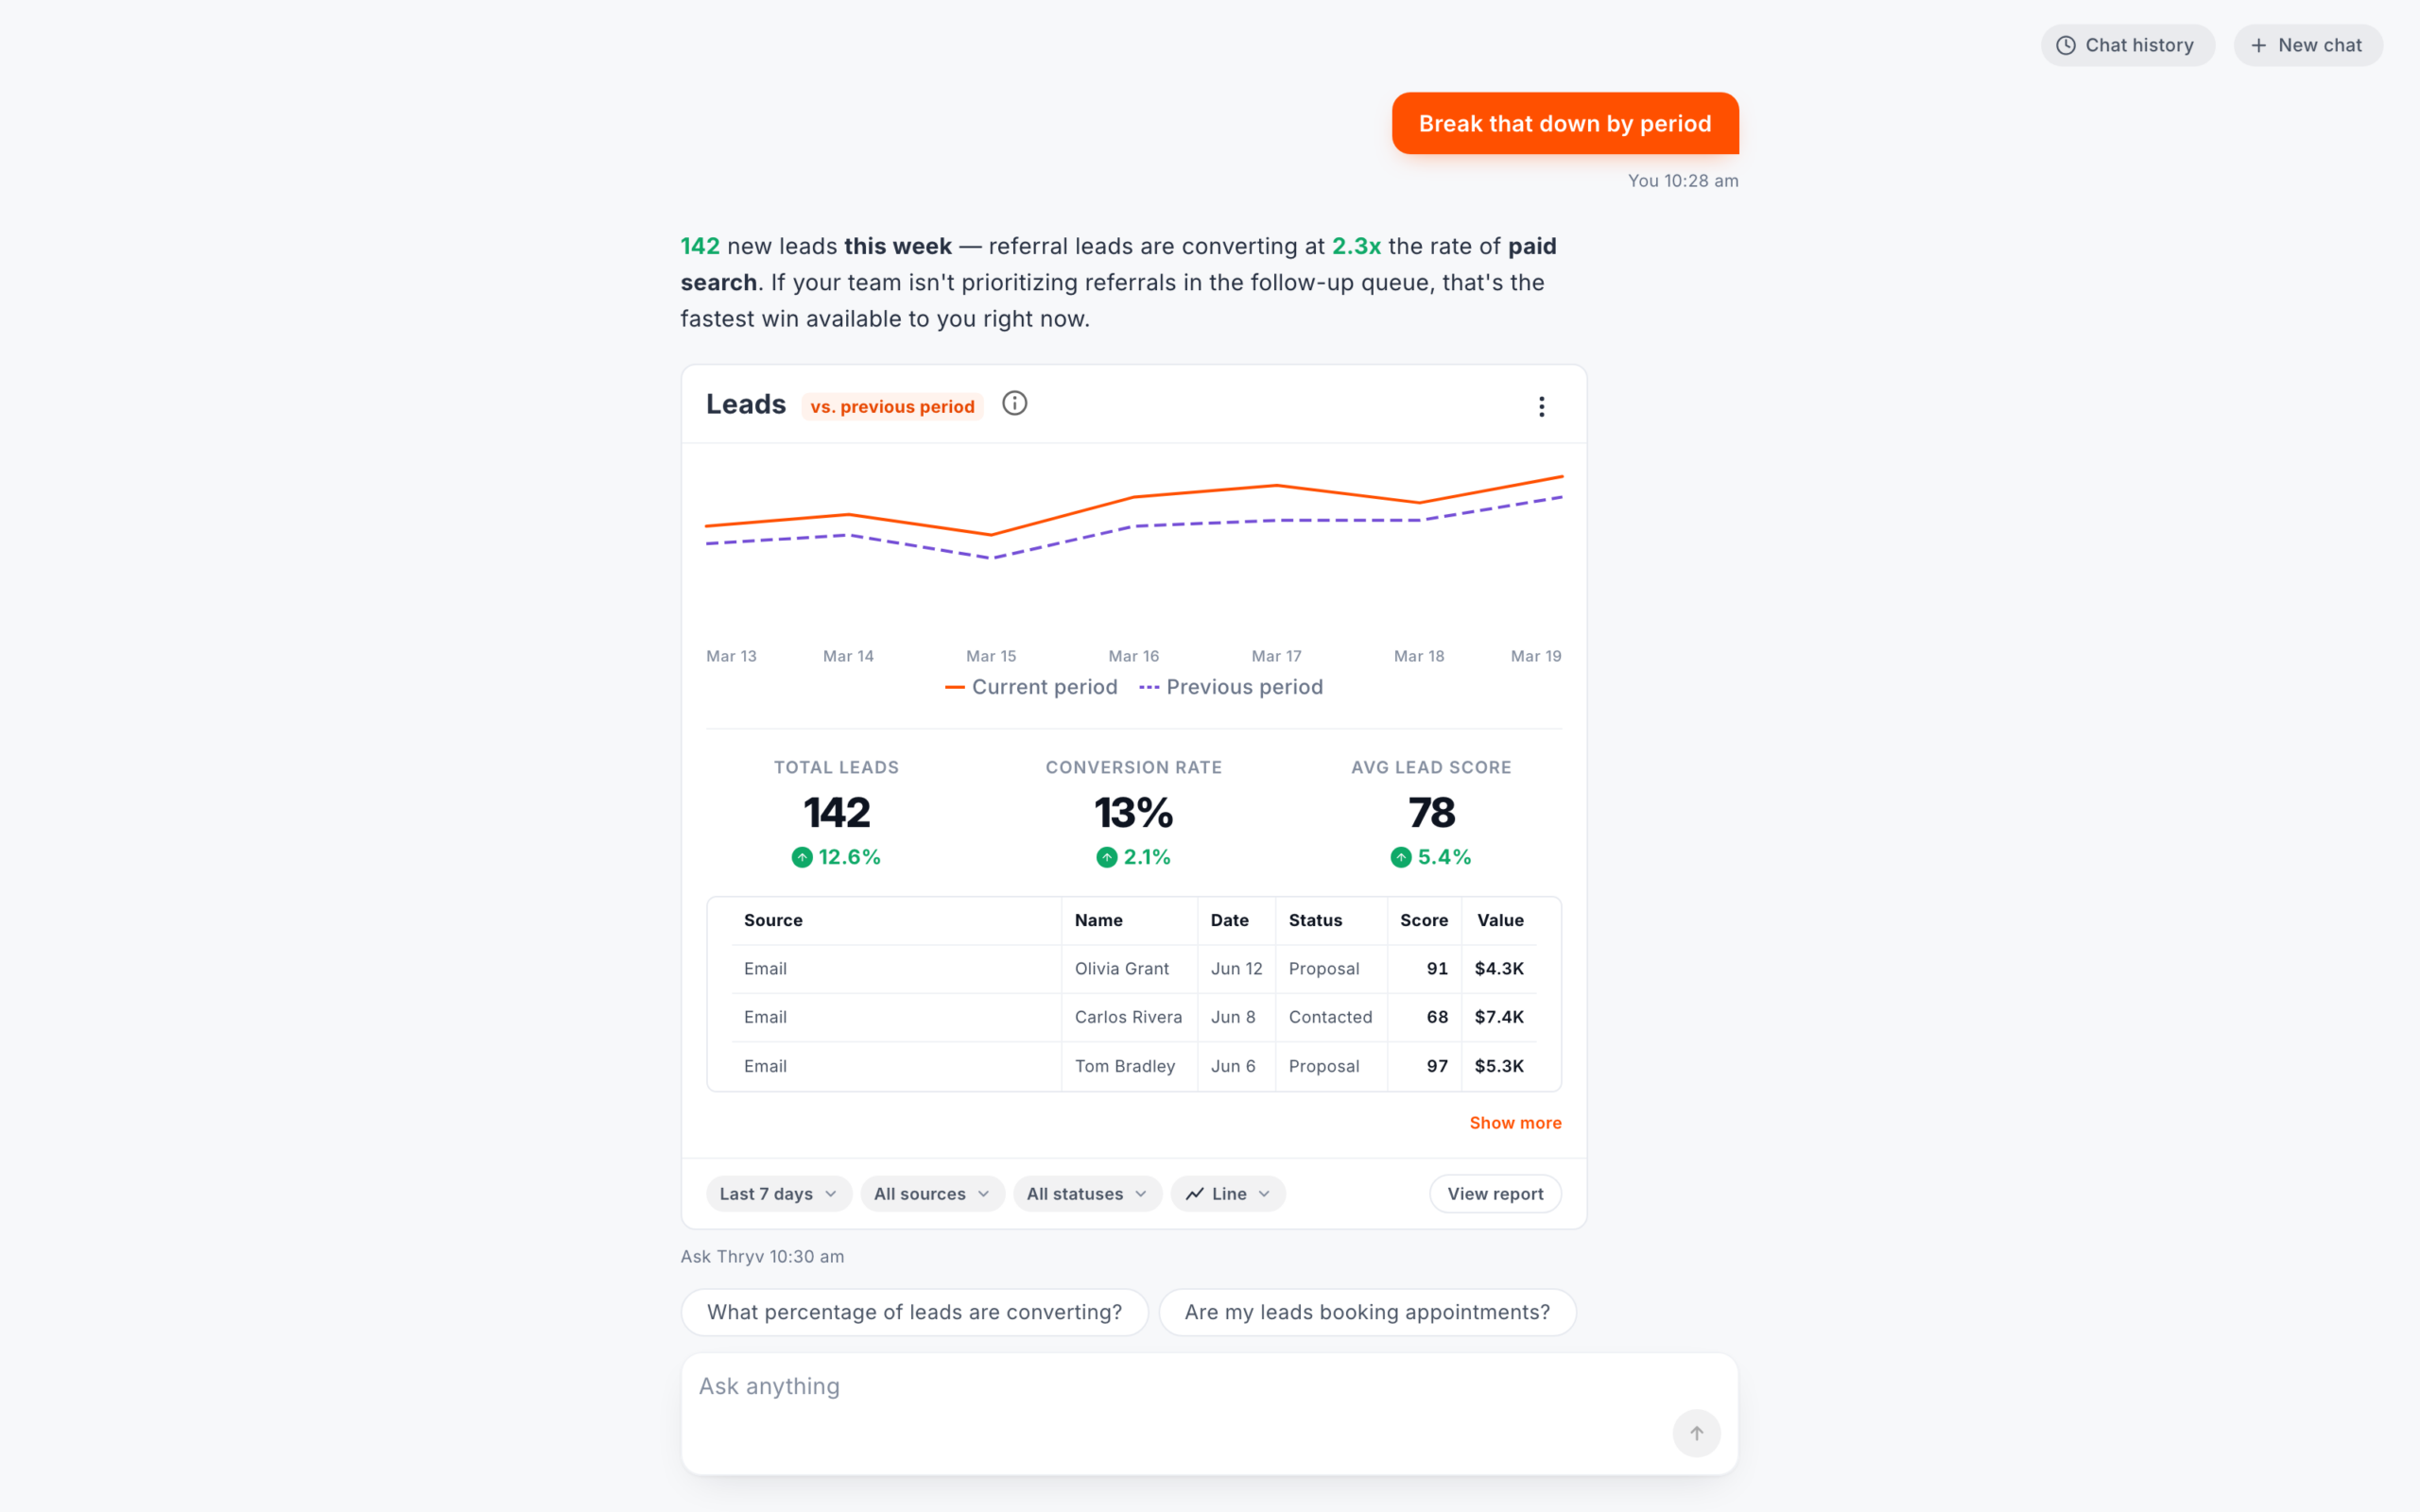
Three rows, then Show more
Version B
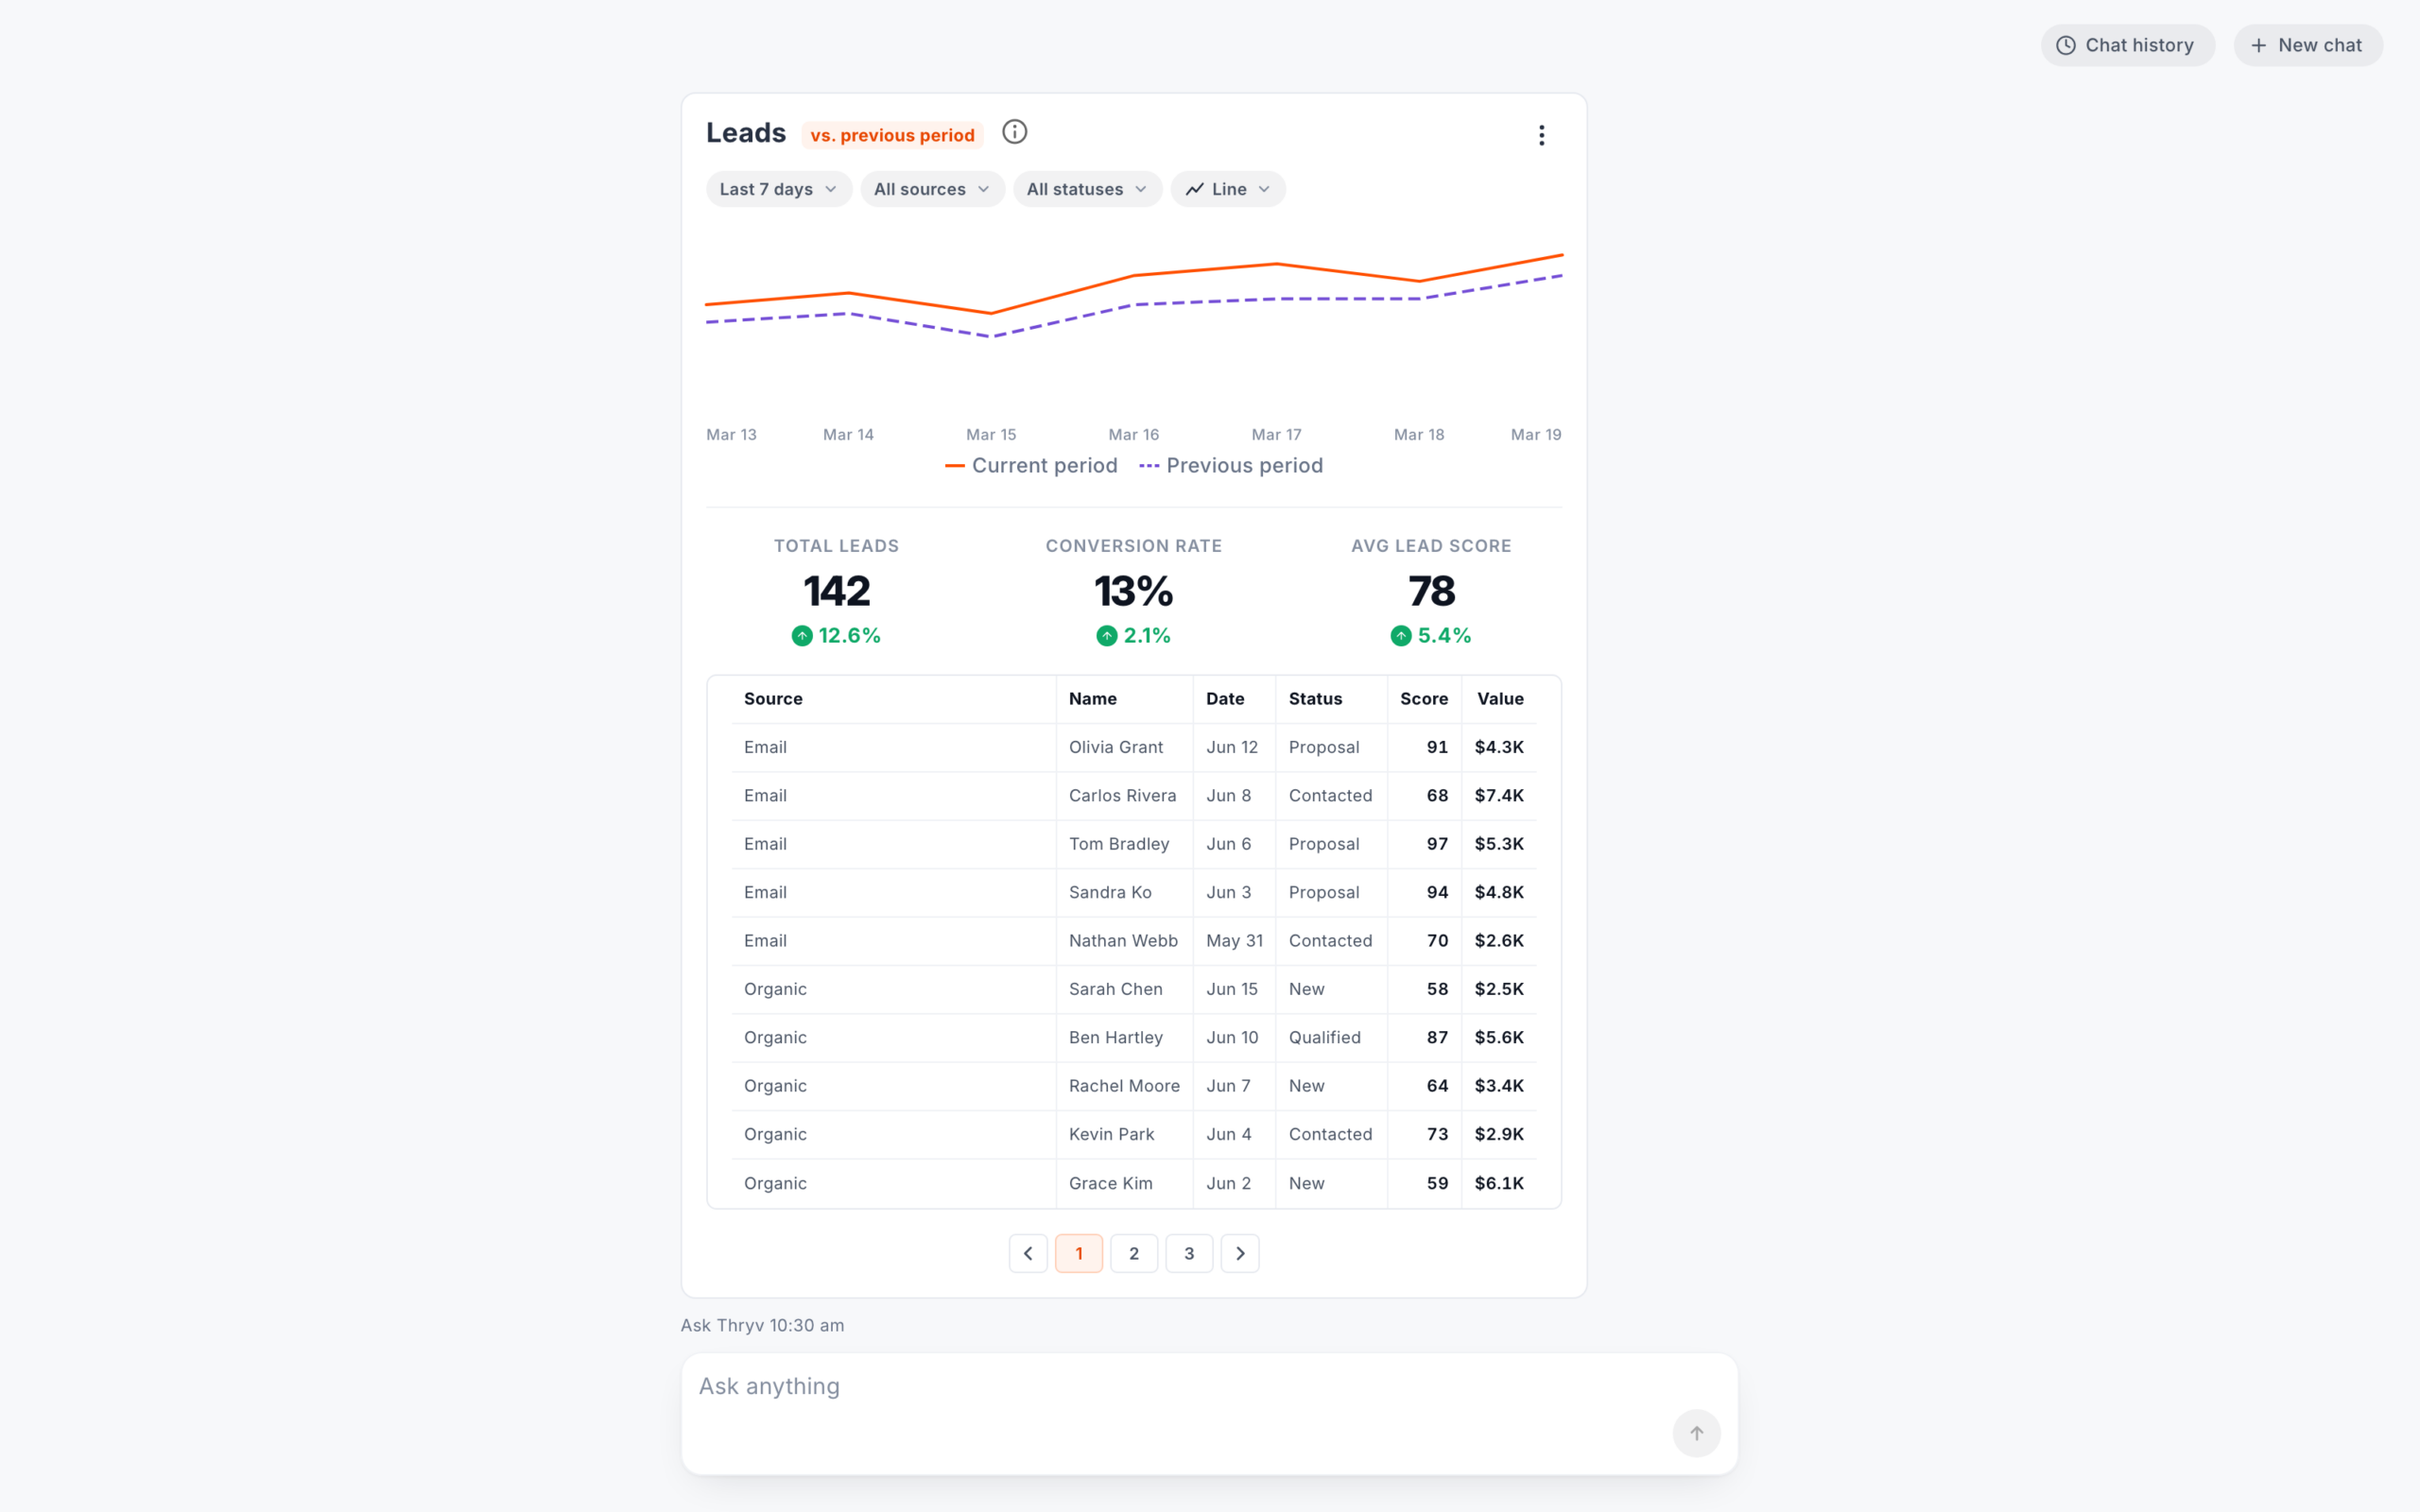
Numbered pages
Both opened the breakdown on its data, under the card's chart and totals.
Version A
EmailTom BradleyJun 6Proposal97$5.3KShow moreLast 7 daysAll sourcesAll statusesView reportAsk Thryv 10:30 amWhat percentage of leads are converting?Are my leads booking appointments?Ask anythingType a request
Version B
Leadsvs. previous periodLast 7 daysAll sourcesAll statusesNo chartTOTAL LEADS14212.6%CONVERSION RATE13%2.1%AVG LEAD SCORE785.4%SourceNameDateStatusScoreValueEmailOlivia GrantJun 12Proposal91$4.3KEmailCarlos RiveraJun 8Contacted68$7.4KA chart menu, or type
Round two opened breakdowns with no chart until you picked one from the chart menu in the card footer.
Round one: Version A and Version B
| Control | A · Controls below | B · Controls above |
|---|---|---|
| Card controls | In the card footer, under the data, with menus that open upward | Above the content, with menus that open downward |
| Long breakdowns | Three rows, then Show more | Numbered pages |
| Chart on a card | Line, Column, Area, Bar, Donut, Hero or Table for leads | Identical |
| Chart on a breakdown | A chart menu only when the card already has a chart, otherwise type a request | Menu on every breakdown (No chart on a new one), or type |
| View report | A button on each card, which did nothing | No button on leads cards, just an item in the card's menu, which also did nothing |
| Everything else | Identical welcome, suggested questions, sample data and scripted answers | Identical |
From the final test script and the round one prototype's code. The Version A and B stills above are from its last build, made after the sessions, with the leads card switched to Area from its chart menu. Layout, controls and chip labels match the July sessions.
Round one to round two
| Control | Round one | Round two |
|---|---|---|
| Answers and chips | Keyword rules and scripted answers, with chips set by hand for each metric | A real LLM wrote the answers from my AI service's data, with chips that follow the conversation |
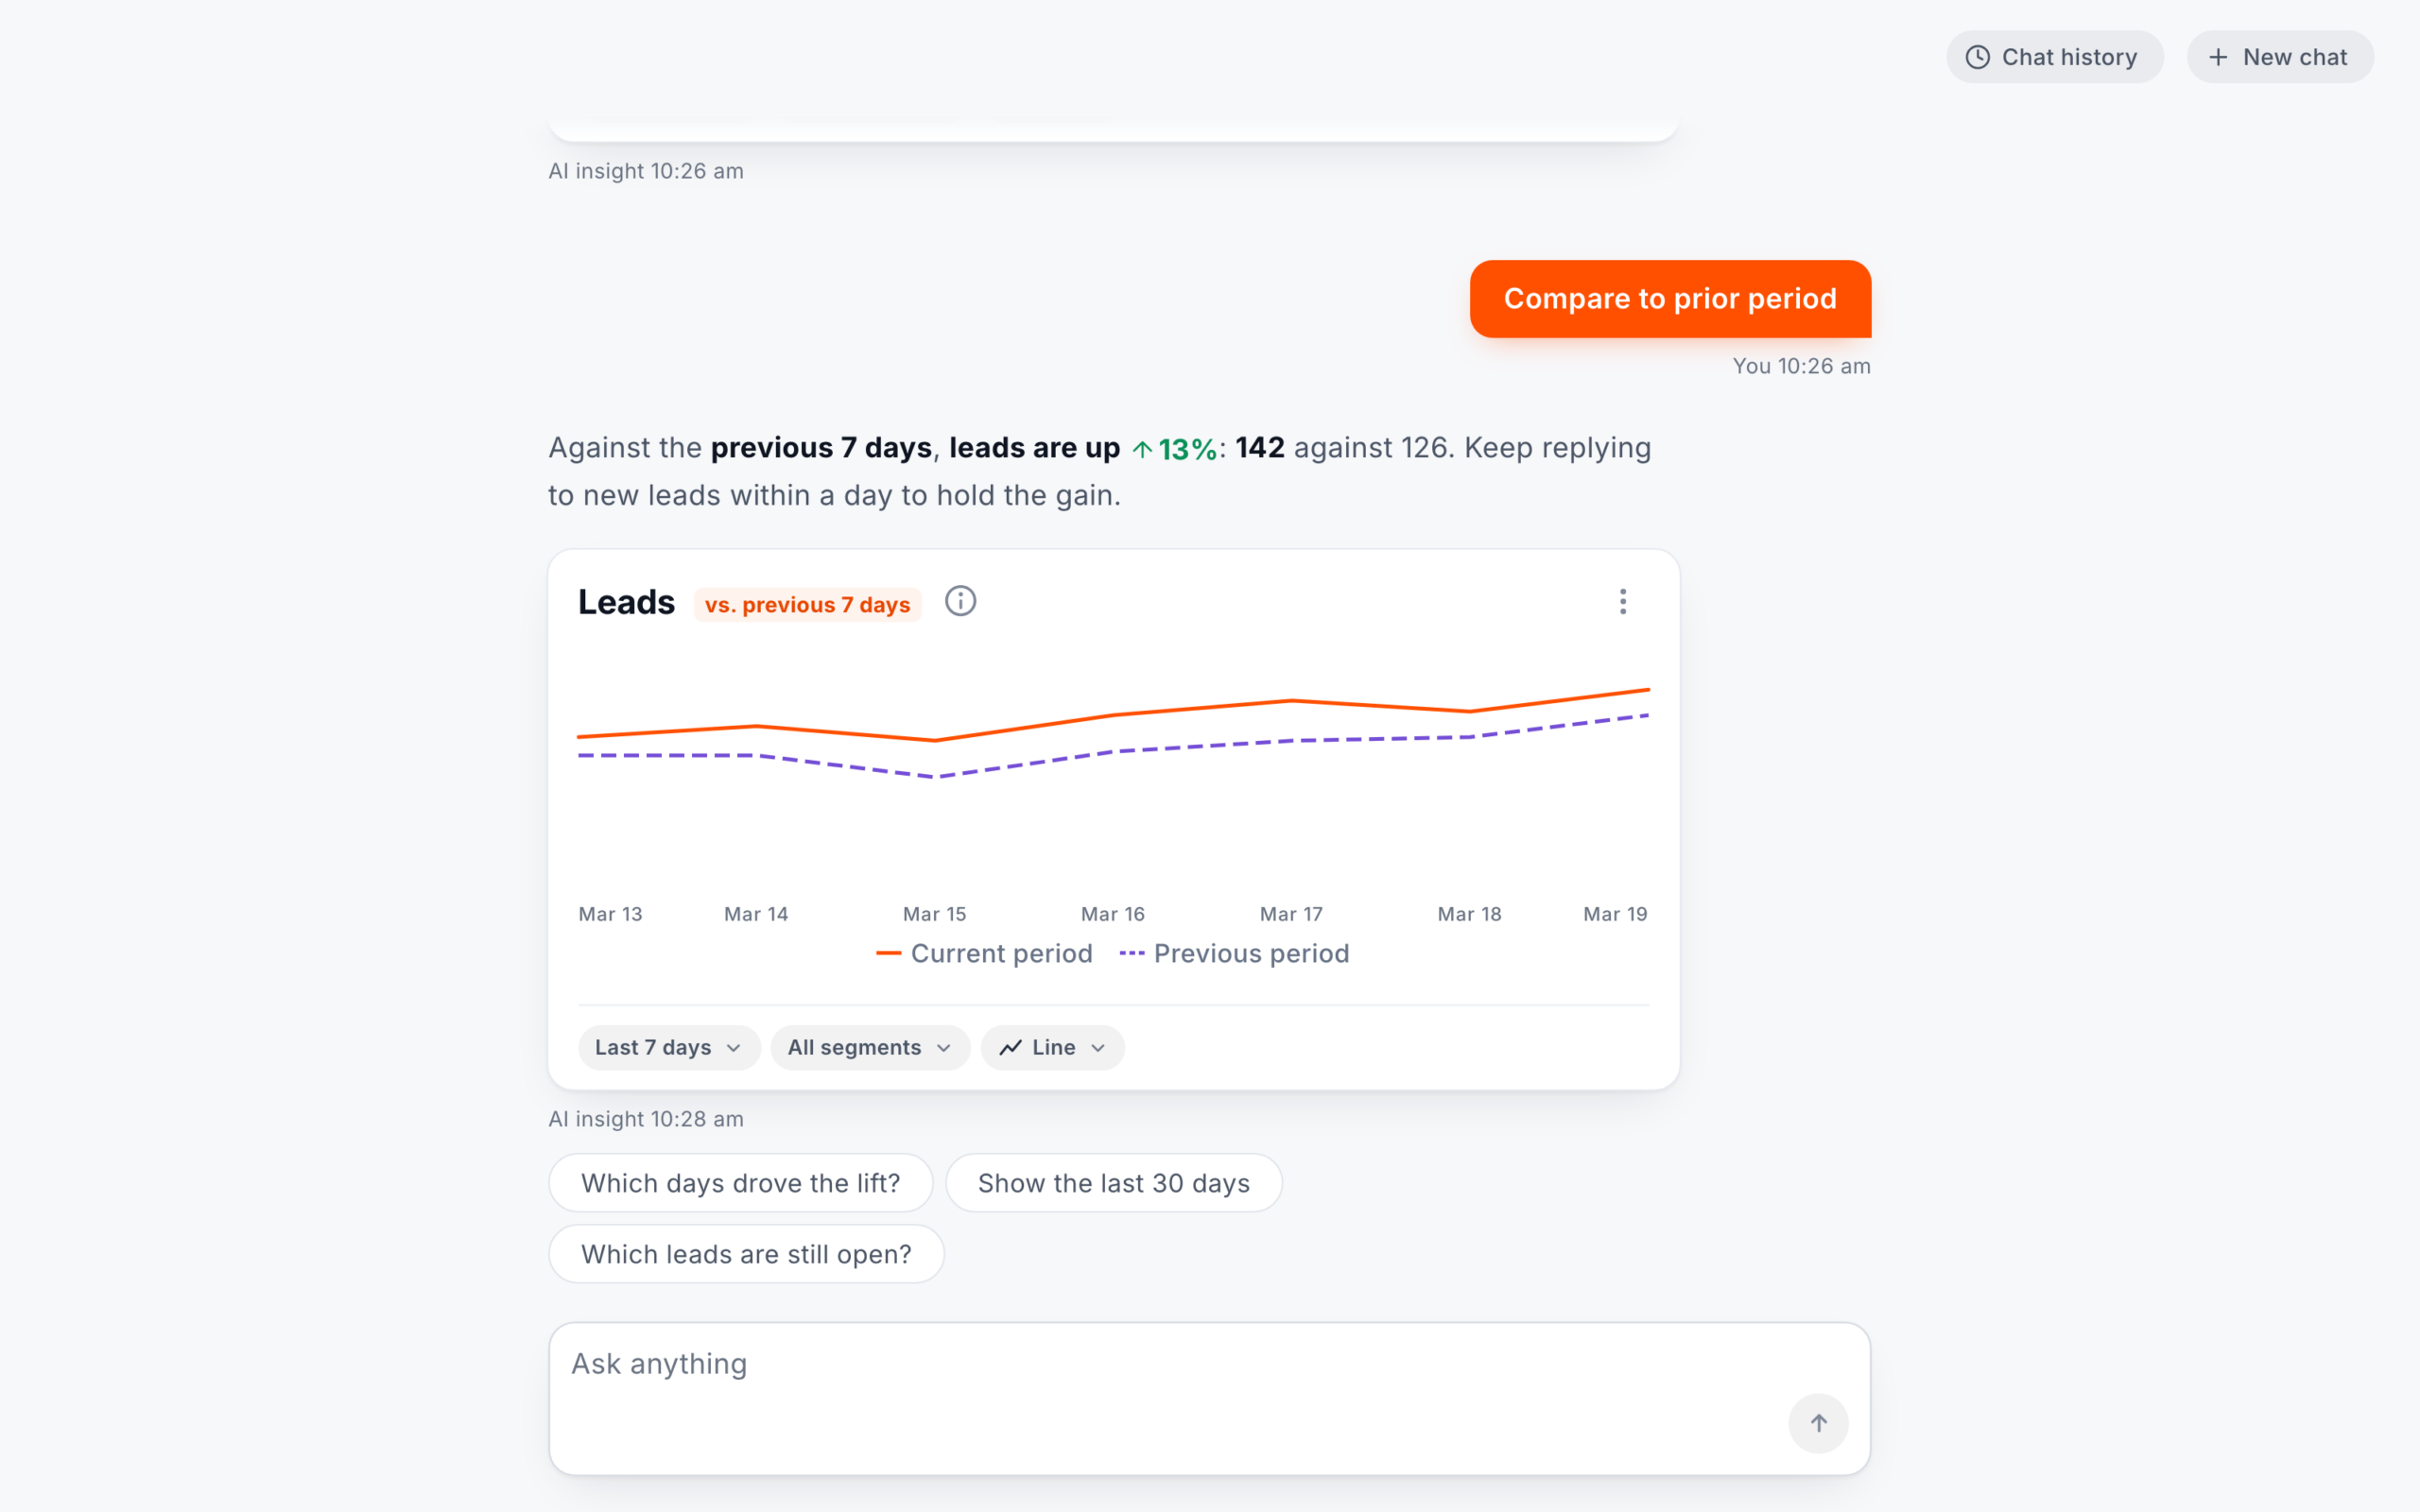
| Comparisons | Only when asked, labeled vs. previous period, with the timeframe only in the date range pill | Only when asked, with the timeframe named next to the metric to match the date range, such as vs. previous 7 days |
| View report | A button (A) or a menu item (B) that did nothing | Removed, and the card's menu stayed |
| When it couldn't answer | Text only, with a general reason and chips about other metrics | Text only, saying why and what to try, with chips it can answer |
| Card controls | In the footer (A) or above the chart (B) | Kept In the footer, as in A |
| Breakdowns | Opened on the data in both, and you typed to add a chart (B also had a chart menu) | Refined Open on the data with no chart until you pick one from the chart menu in the footer |
Round one from its code and the July sessions. Everything else, from the welcome screen to the layout, stayed the same.
Round one · July
I built round one in Claude Code as one React app with both versions. Five keyword rules and scripted answers meant the same words always got the same reply. Our lead researcher helped run it, unmoderated, with small business owners and decision makers, and each did the 5 leads tasks in both versions.
All 9 started with a suggested question, even after an intro that told them to type like a search engine.
This is so good because I don't even have to type in.
In Version A, about half changed the period by typing and half with the card's control, so both had to give the same answer. They didn't always. In B, one person said typing gave "a more detailed answer" than switching the period. In A, another lost the summary after switching to 90 days.
In the design tasks I created afterwards, I set one rule. A control updates the card in place, a question adds a new card, and changing the chart type never rewrites the text.
Round one · July
9 people
each used both versions
5 started with A 4 started with B
Dental, retail, construction and trades, field service and more
Round two · August
20 people
each used one prototype on a real LLM
Same screener · same 5 tasks · unmoderated · desktop
Small business owners and decision makers, from the final screener
Same in both roundsUnmoderated, on the same testing platform, on desktop
Same in both roundsA 30-second first look, and a 1 to 7 ease rating after each task
Same in both roundsRound one: 9, each using both versions
Round two: 20, each using one prototype
Round one: Rules and scripted replies
Round two: A real LLM and my AI service
Round one: After each version, with 8 completing it for A and 7 for B
Round two: Once, completed by all 20
Round one: None added Three comparison questions closed the session.
Round two: Was the comparison clear? asked after the compare taskAn error task then, did the reply help?
Diagram: in round one, every participant used both versions. 9 participants split into two groups: 5 used Version A first and 4 used Version B first. Each version session was a 30 second first look with no clicking, 5 tasks with a 1 to 7 ease rating after each, then the usability scale, before switching to the other version for the same steps. Three comparison questions closed the session. 8 people completed the usability scale for Version A and 7 for Version B. The five tasks: check this week's leads, compare to the previous period, pull up the last 90 days, break leads down by source, and explore the rest of the data. 7 of 9 check their data daily. 3 are main decision makers, 5 share decisions with an owner and 1 leads one area.
| Changed | First draft | Final script |
|---|---|---|
| Tasks | 7, with revenue tasks in Version B | 5 leads tasks, identical in both versions |
| Date range | The last 30 days | The last 90 days |
| Chart task | Turn the breakdown into a donut chart | Removed, and asked as a comparison question after both versions |
| Ratings | Follow-up questions after each task | A 1 to 7 ease rating after each task, and the usability scale after each version, before seeing the other |
Chart, round one, task by task: mean ease out of 7 and mean time on task, Version A then Version B. Task 1, check this week's leads: ease 6.89 and 7.00, 99.6 and 55.0 seconds. Task 2, compare to the previous period: 6.56 and 6.44, 63.4 and 52.3 seconds. Task 3, pull up the last 90 days: 6.67 and 6.44, 68.9 and 62.2 seconds. Task 4, break leads down by source: 5.33 and 5.22, 110.0 and 92.4 seconds, the slowest task in both versions. Task 5, explore the rest of the data: 4.44 and 4.11, 78.6 and 65.8 seconds, the lowest rated in both versions. The two versions were within 0.33 on every task.
Round one means from the testing platform's export. Times include thinking aloud and first-use learning, and 5 of 9 saw Version A first. Usability (SUS) from 8 and 7 completed questionnaires. The medians were 76.25 and 82.5, and one score of 27.5 pulls B's average down, so neither version won. Ease ratings (1 to 7) came from all 9 after every task. With 9 people in round one, all on desktop, the gaps between A and B are only suggestive.
It was a placeholder, but 4 of 9 in round one clicked it while looking for the rest of the data, and 3 of them rated the explore task 2 or lower in both versions. Round two removed it and left the report view for a later phase.
Round one's compare chart showed only this week's dates. 3 of 9 raised it unprompted, and one asked, "is that the previous month? ... or is that the previous year? Oh, is it year over year?" Round two named the timeframe next to the metric.
Close-ups use sample data.
What changed for round two
The biggest change was a real LLM on the AI service I built. The LLM wrote the chips and the reply when it couldn't answer. The rest were small changes to the interface.
Kept and refined from round one. Card controls stayed in the footer, as in Version A. Breakdowns still open on the data, now with no chart until you pick one from the chart menu in that footer.
Round two · August
Round one's session videos showed why it had to be real. One wrong scripted reply could shift how an excited participant felt about the feature. I went beyond the project's requirements, built round two in Claude Code on a real LLM and ran it on my own. The screener and the 5 tasks stayed the same, and I added questions about the comparison and an error.
One question, two rounds. The same typed question in both rounds: "which sources are driving this number". Sample data.
Round one, rules: five keyword rules read it (Out of scope?, Period, segment, chart, Metric, Typos, Last turn). The first rule caught it as out of scope, though the data was there, behind a chip labeled Break that down by period. It gave a general reply: I wasn't able to find "Which sources" in the available metrics. This could mean it hasn't been connected yet, or it may live in a different data source.
Round two, a real LLM: Sonnet 5 read the question as written, following rules and guidelines I wrote, including Thryv's voice and tone. It looked up the answer through tool calls to an AI service I built, on a test environment, with sample data that had no gaps. It answered with a new card, Leads by source for the last 7 days, compared with the previous 7 days: Paid search first with 38, up 5, then Organic 32, Social 28, Referral 23 and Email 21.
Before it answers, Ask Thryv works out which number, which dates and whether to compare. In round one, five keyword rules did that, and anything outside them got a general reply with chips. In round two, a real LLM read the question.
With sample data, the typed question which sources are driving this number, in both rounds. Round one, rules and scripted answers: a text-only reply that it could not find Which sources in the available metrics, with a general reason and chips about revenue and bookings. Round two, a real LLM: a new card of leads by source for the last 7 days, still compared with the previous 7 days, paid search first with 38, up 5, then organic 32, social 28, referral 23 and email 21, with chips that follow the thread. In the card spec, round two added split: By source, from the word sources.
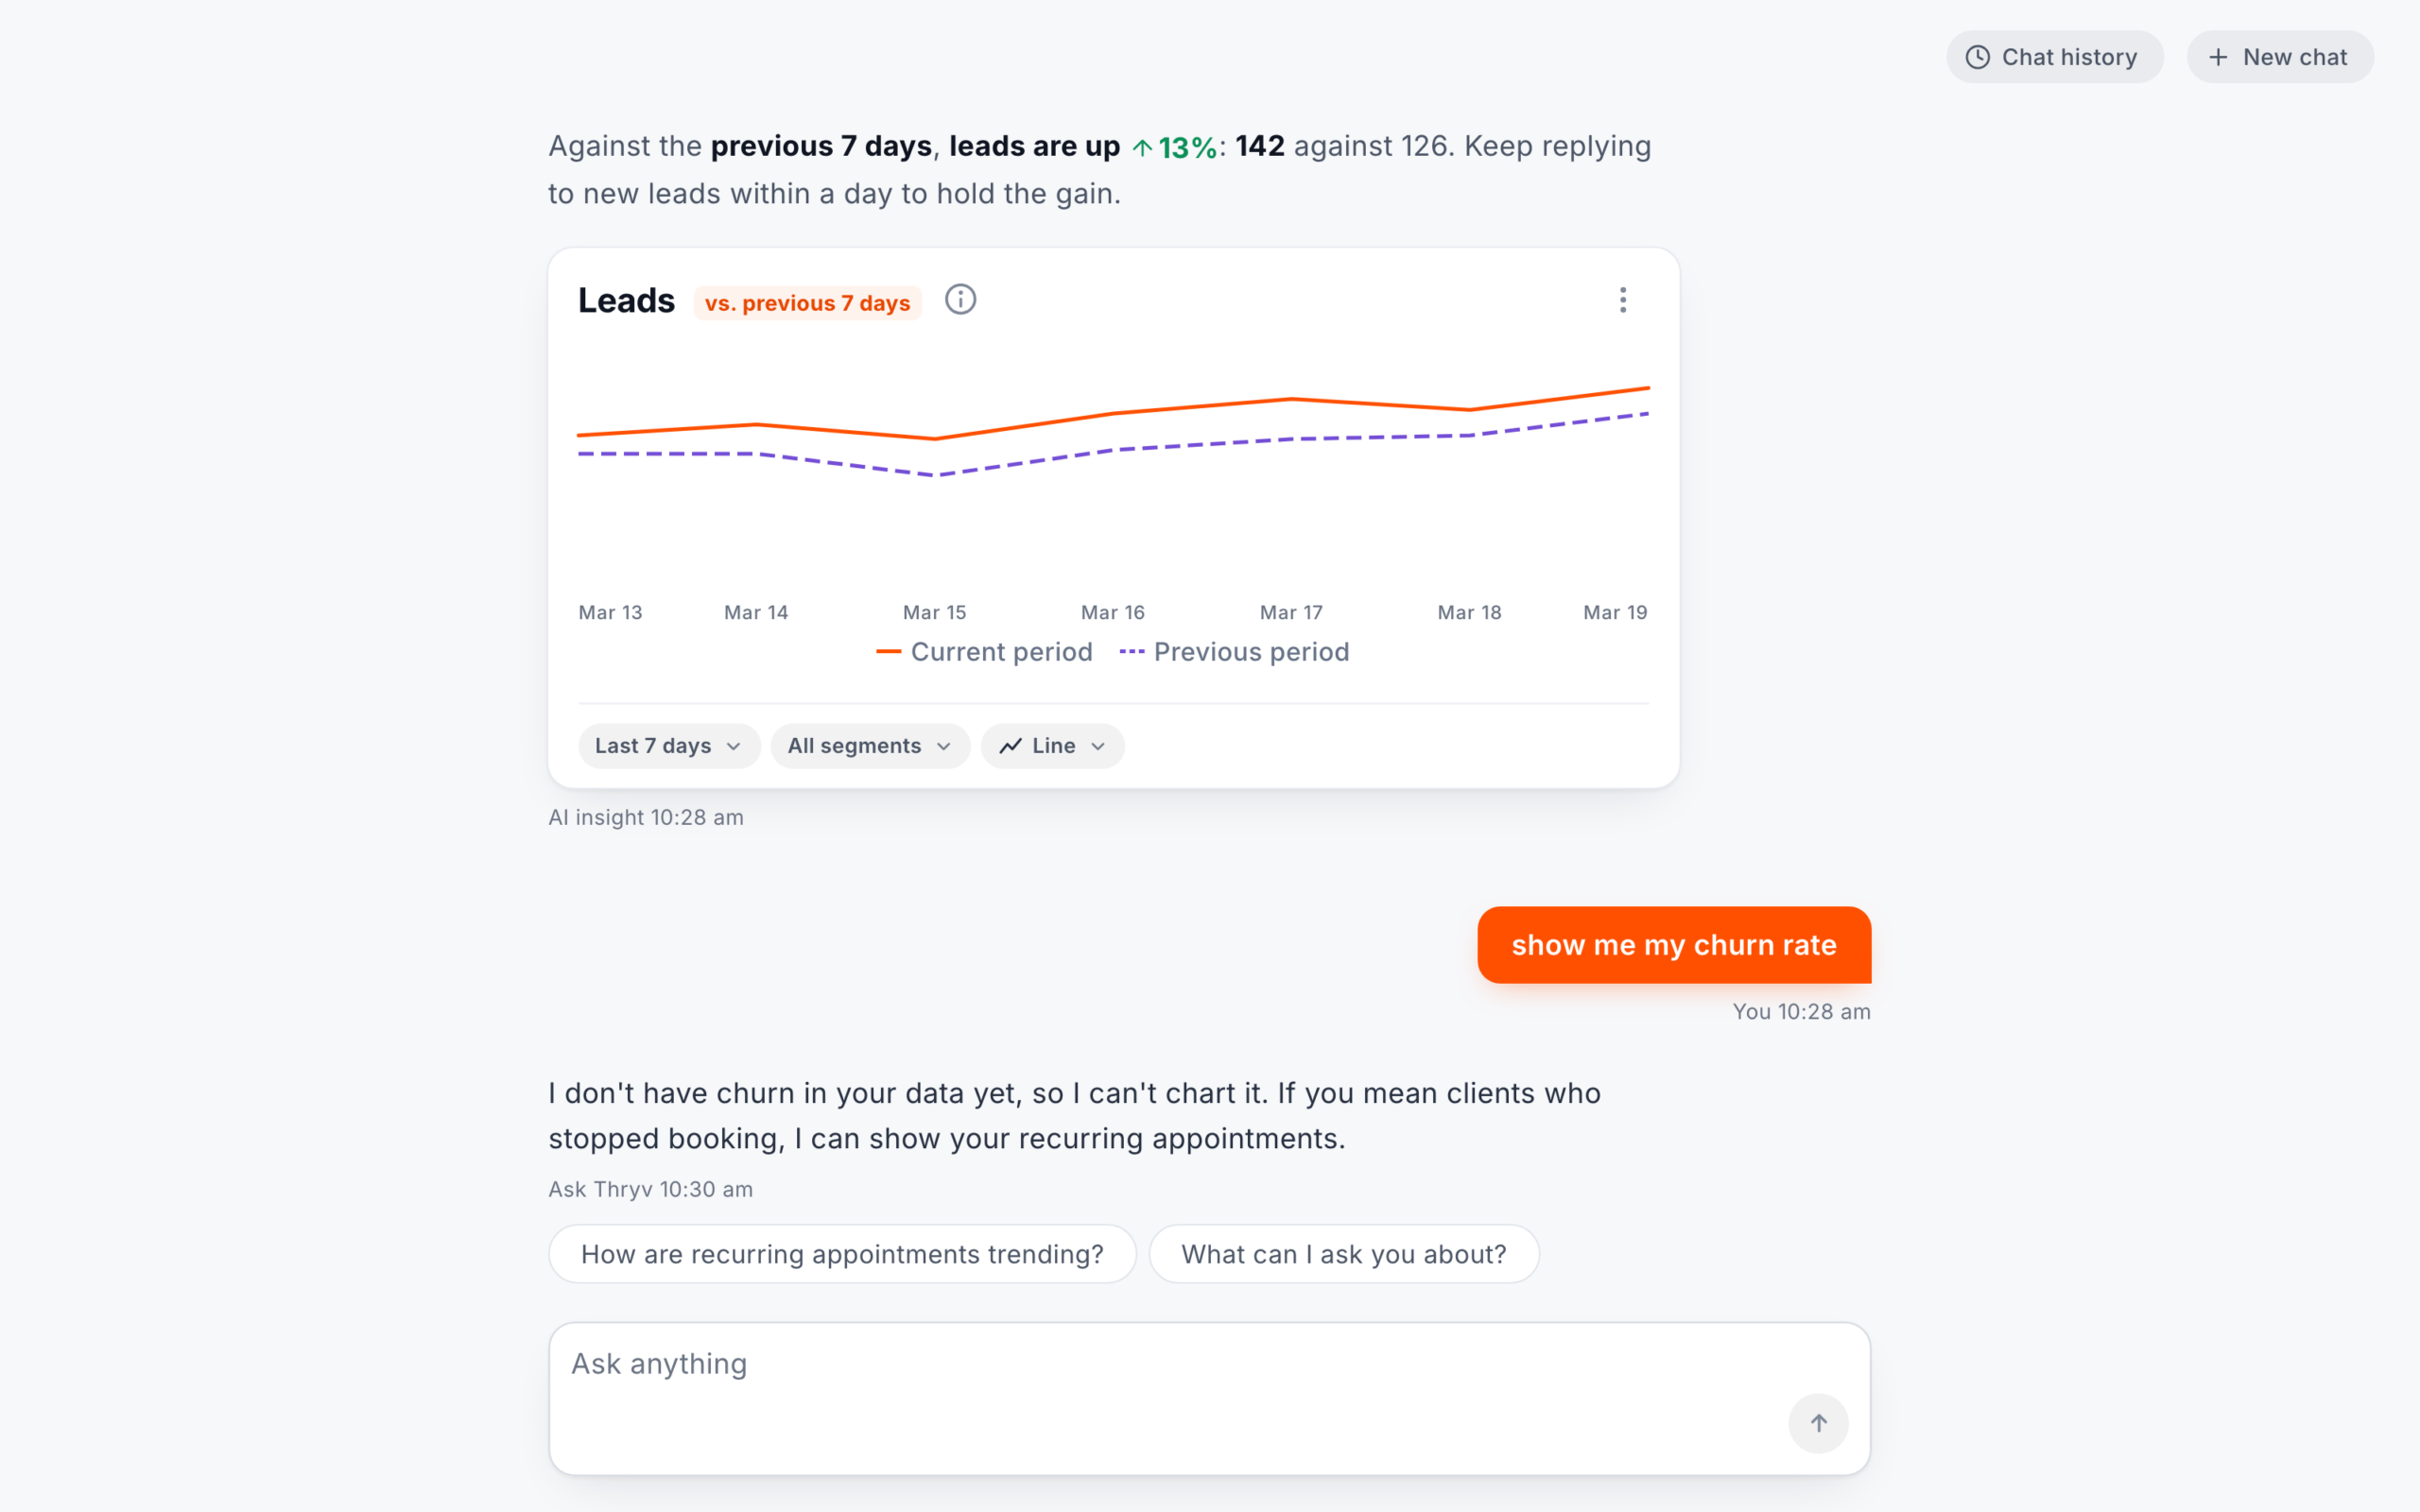
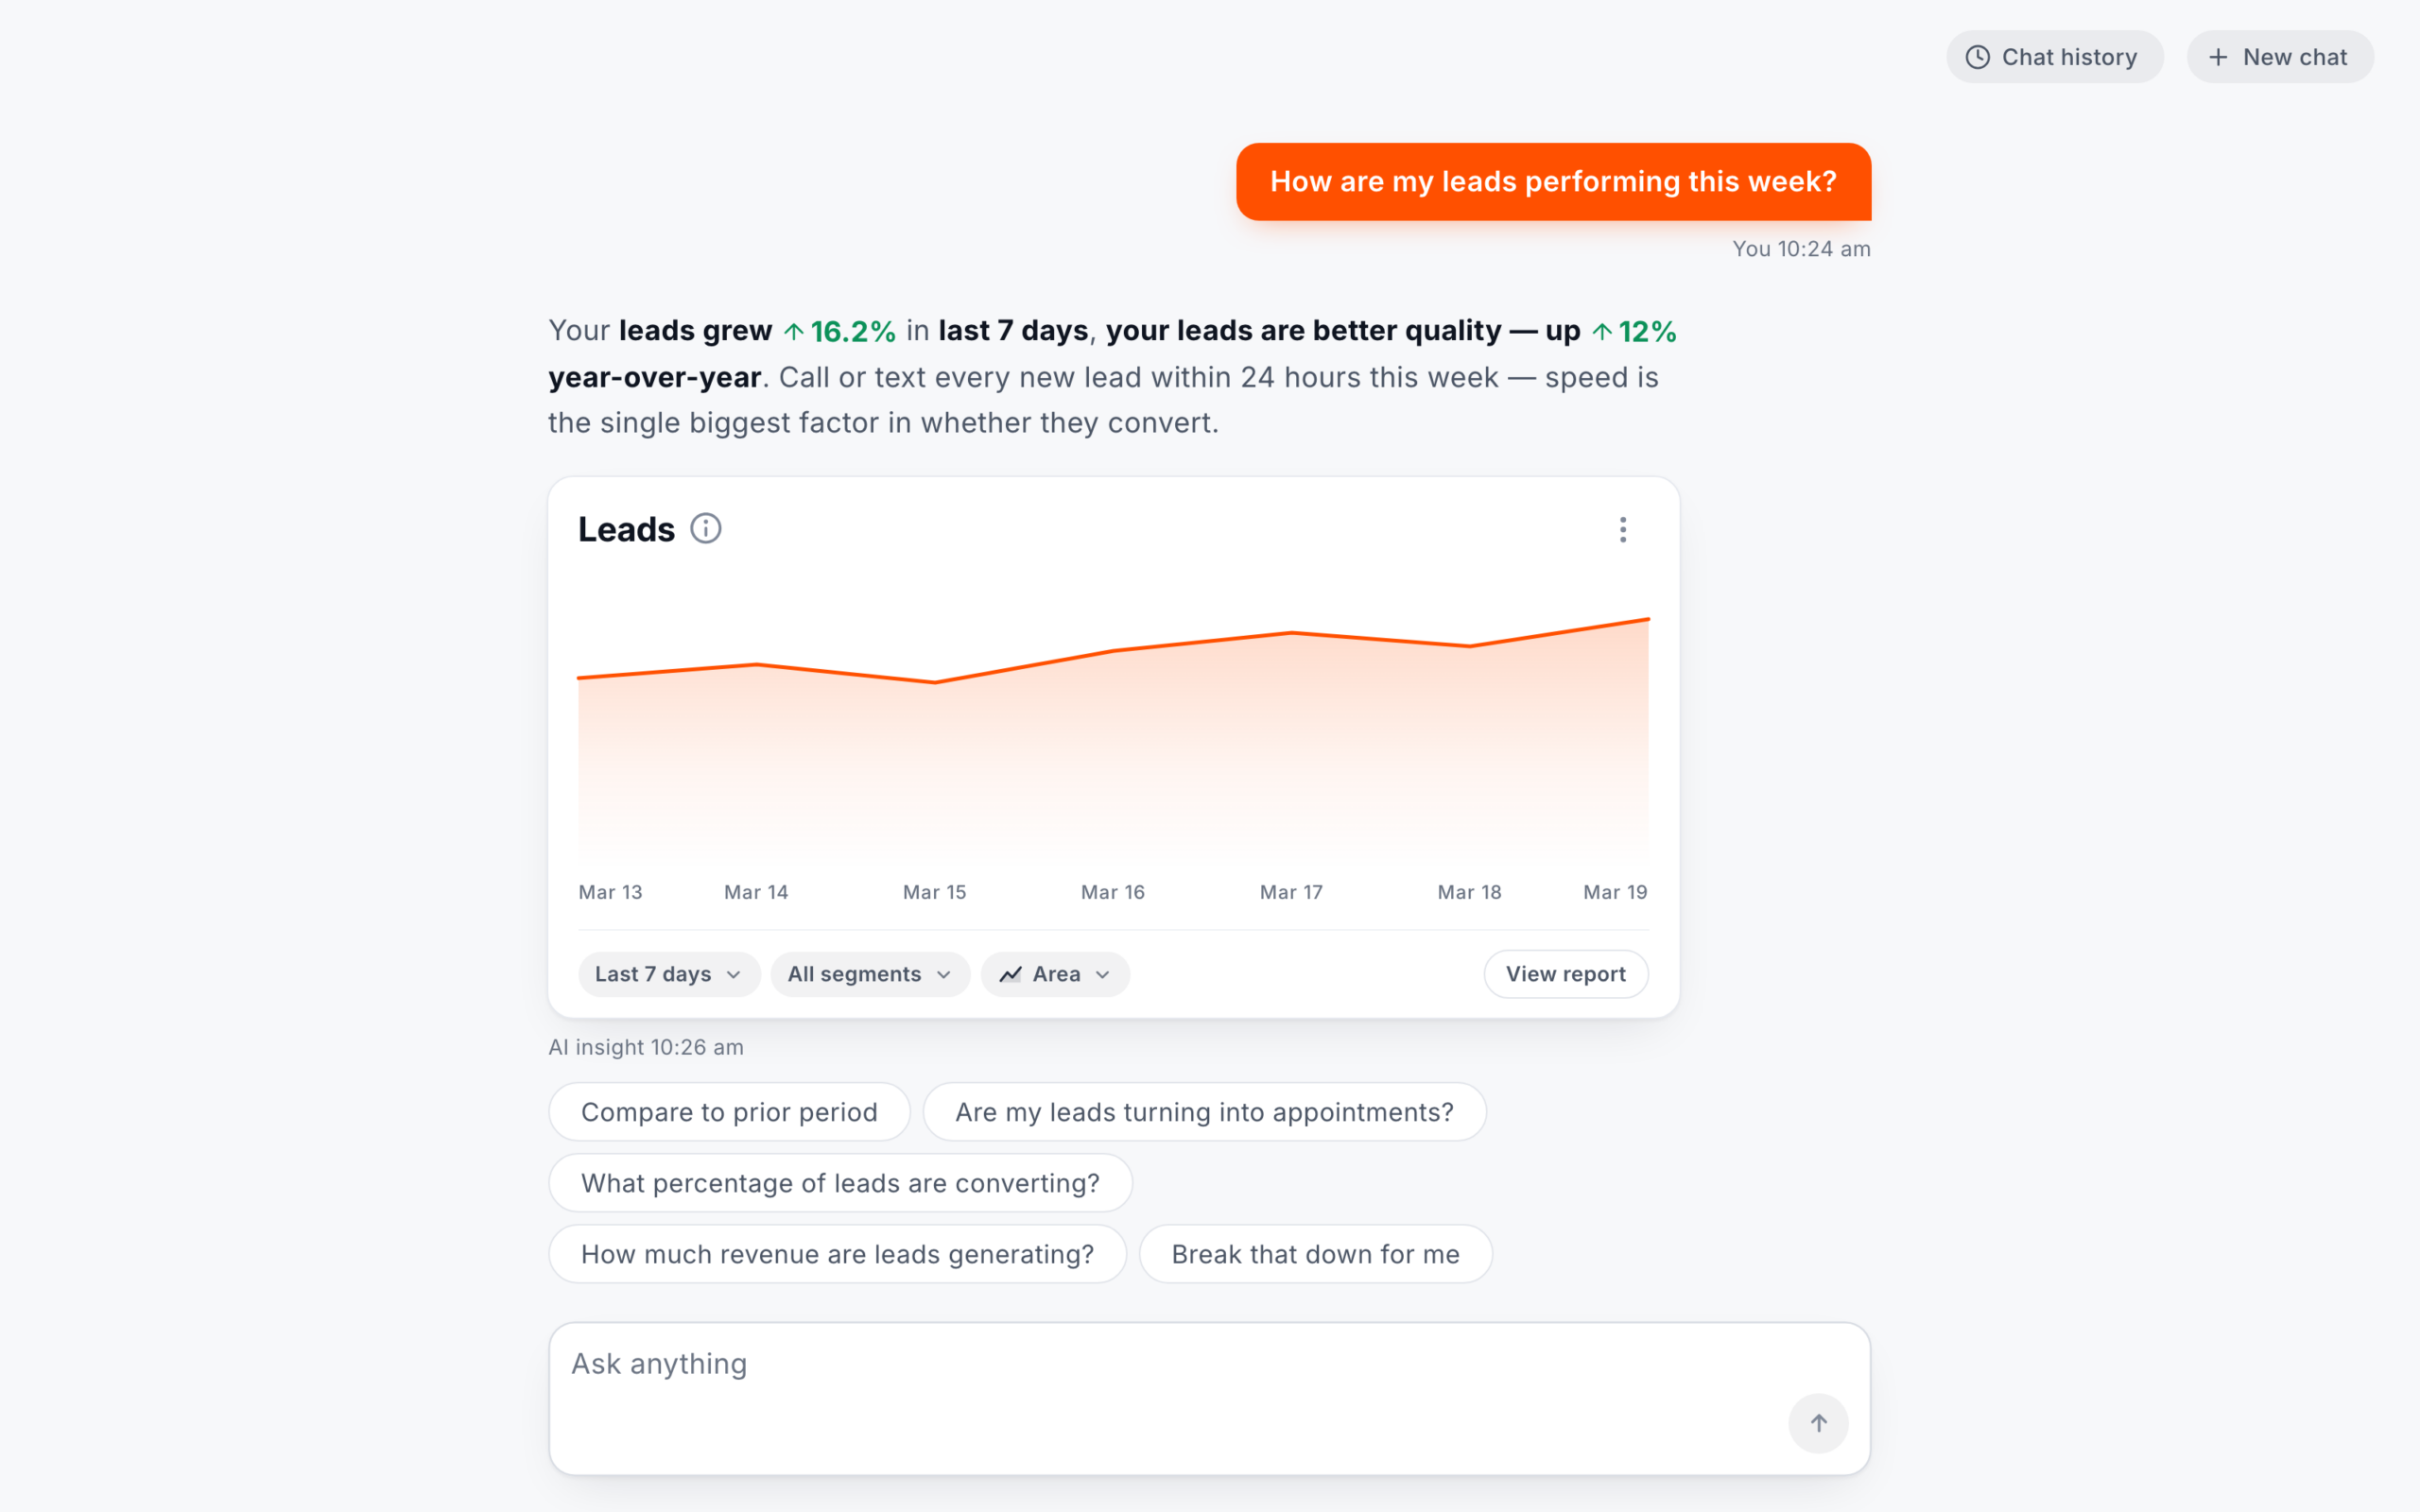
With sample data, two more questions in both rounds, each shown while its reply was the newest. The tapped chip Compare to prior period. Round one repeated the answer and tip before it, Your leads grew 16.2% in last 7 days, your leads are better quality, up 12% year-over-year, over a new Leads card labeled vs. previous period, with footer controls Last 7 days, All segments, Line and View report, and chips set by hand for leads. Round two said that against the previous 7 days, leads are up 13%, 142 against 126, with a tip, over a new Leads card labeled vs. previous 7 days next to the metric, footer controls without View report, and chips written for this answer. The typed question show me my churn rate. Round one gave the same text-only reply and chips as for sources. Round two replied in text only that churn is not in its data yet, pointed to recurring appointments instead, and offered two chips it can answer.
Diagram of round two: a real LLM read all three questions as written. It named the compared period, added a card by source, and said churn was not in the data yet. In round one, the rules caught both typed questions as out of scope.
Round oneFive keyword rules read each question, with no model
Round two reached the breakdown from the word "sources". Typing adds a new card. A card's own footer controls update it in place.
Round oneThe leads breakdown by source was already there, behind a chip labeledBreak that down by period
A new question about something else resets the period and segment, unless the question names a date range or filter, or the tapped suggestion does (for example, one that says last week).
In round two, the chips the LLM wrote built on the latest question and related earlier ones.
Results
Round one sat in the Good band, and round two reached Excellent.
Chart: usability (SUS) on a 0 to 100 scale. Round two, one prototype on a real LLM: 82.4 from 20 people, in the Excellent band, 80.3 and up. Round one, scripted: Version A 78.4 from 8 of its 9 people, and Version B 76.4 from 7 of 9, both in the Good band, 68 to 80.2. A line marks the 68 average.
In round one, 9 people each rated both scripted versions. In round two, 20 people rated one prototype on a real LLM. The two rounds were set up differently, so the higher score is a good sign but doesn't prove the changes caused it.
It's so cool to ask a simple question and get a detailed visual answer that shows how my business is doing, tells me why, and suggests what to do about anything that isn't performing well. And I love having quick controls to tweak the chart right there in the chat.
New in round two
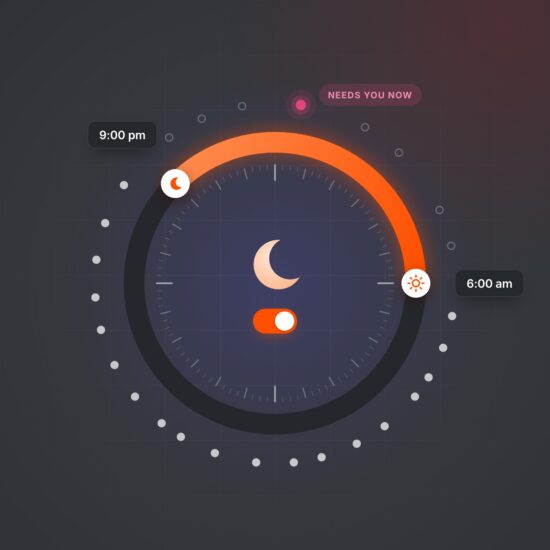
In round two I asked people to trigger an error on purpose.
Most said the reply helped.
What people valued
The bands come from the round one report. Good runs from 68 to 80.2, and Excellent from 80.3.
In round one, 8 of the 9 completed the usability scale for Version A and 7 for Version B. In round two, all 20 completed it.
Round one's order and counts come from the testing platform's export and the usability questionnaires.
What came next
Engineering chose my chart library over the outdated charts.
Timeline: round one in July, with 9 people and two scripted versions. I built the changes into one prototype in Claude Code. Round two in August, 2 to 3 weeks after round one, with 20 people and one prototype on a real LLM. The prototype and its repo handed off to engineering. Then engineering's beta with Thryv users, starting in November 2026.
About150Thryv users in the beta
Where it stands · November 2026
Beta starting
Engineering has built Ask Thryv, and its beta is starting.
Looking back
Round one's rules behaved the same way every time, so its findings were about the interface, such as the comparison labels, the chips, a placeholder button and where the controls go. I acted on each one in round two.
Scripted answers kept round one controlled, but they could not follow what people asked or how they asked it, and that cost trust. Reporting was the first part of the chat to roll out, and in both rounds a few people asked for things outside it, so I'd make that scope clear from the first screen. I would also test labels like "source" before round one, since its report found the word unclear.