Thryv · AI product design case study
SMB Reporting
Three AI reporting dashboards, tested with 53 small business owners
I planned the study and designed three versions of a reporting dashboard. I built them as working prototypes with Claude Code, along with the live AI service behind them, and 53 owners each tested one version.
- Role
- Lead Product DesignerResearch plan to working code
- Timeline
- Jul to Sep 2026About 2 months, discovery to report
- Research method
- 53 owners, unmoderatedThree versions, one per owner
- Usability score (SUS)
- 92.7, the top versionAll three above the 68 average
The problem
Owners said they check 3 to 5 separate tools to see how the business is doing.
About 70% named QuickBooks, with spreadsheets filling the gaps, and none had one view of revenue, leads and customers together. Their tools showed what a number did, but rarely why it moved.
I have MailChimp, QuickBooks, and a spreadsheet that I made three years ago. They do not talk to each other. I have to be the connection.
I wanted to find out how much owners want the AI to set up their dashboard, and how much they would rather arrange it themselves.
I designed Version A, where the AI sets up the dashboard, and Version B, where the owner arranges it. Another designer asked me to add Version C, a chat-first dashboard, because it would affect his product area. I built all three.
This study ran alongside Ask Thryv. I built and tested all three versions at the same time. Version A's chat panel reused Ask Thryv's logic and its chart library with simpler options on each chart, since the study tested whether owners would add a chart from the chat to their dashboard, not the charts' own features.
The 30-second read
Owners scored the dashboard they arranged themselves highest.
My research and prototype went to product for its dashboard redesign.
I built three working versions on one live AI service.
I used Claude Code for all three and for the AI service behind them. Trace an AI answer
Owners still wanted a template to start from.
B, the version owners arranged themselves, scored 92.7 against a 68 benchmark. Nobody wanted a blank canvas, so I recommended a hybrid built on B.
My role: Lead Product Designer and PM, end to end. I owned the research plan, screener and test script, both waves of unmoderated testing, the analysis and final report, and the design, plus the working prototypes and AI service I built for the study.
See all three working · 40 seconds
Watch how each version gets a new metric onto the dashboard.
The research plan
I wrote the research plan before building anything.
Then I designed the screener and test script to keep three very different versions comparable, with an addendum for Version C.
research areas, written before any prototype existed
screener questions, each with at least one disqualifying answer
versions of the test script
Plan, script, screener and session details
How the plan split the research areas between versions
| Research area | Version A · AI-forward | Version B · User-controlled |
|---|---|---|
| Which metrics actually matter | Observed, through what people accept or change from the AI's defaults | Tested directly through the metrics people pick themselves |
| Appetite for customization | Observed, through whether people try to change the AI-built layout | Core focus drag-and-drop comfort and template use |
| Where AI belongs | Core focus whether a prominent AI feels helpful or intrusive | Tested directly whether people seek out an optional AI or ignore it |
| How deep people go | Tested directly through AI-assisted deeper exploration | Observed, through whether people click into widgets |
| What brings people back | Tested directly whether AI setup creates enough value to return | Tested directly whether building it yourself creates ownership |
| Trust in AI answers | Core focus reactions to AI insights and errors | Observed, as trust when the AI is optional |
Six of the 13 areas are shown. Version C's mapping is in the addendum.
What changed in the test script, and why
| Changed | From | To | Why |
|---|---|---|---|
| Response types | Written open text | Verbal, multiple choice and 1 to 7 ease ratings | Typed answers in unmoderated sessions come back short and flat |
| Think-aloud | Separate question lists | Folded into the task | Asked afterward, people reconstruct their reaction from memory |
| Platform survey | Platform questionnaire | Removed | It duplicated the closing questions and cost minutes the tasks needed |
| Usability score | 1 to 5 ease and likelihood ratings | Standard 10-item scale | One benchmarked score that compares across all three versions |
| Intro framing | A fictional company, applied to your own business | You run Hartwell, plus what your version shows first | Everyone judges the same business as its owner and knows what their version shows first |
I made these changes over the script's four versions. I also rewrote two task premises after checking them against the code, so that confusion caused by the prototype would not look like a design problem in the results. One premise claimed a metric was visible when the layout logic excluded it. The other asked participants to imagine returning tomorrow, in a prototype with no session persistence.
The session
One session, start to finish
- AAI-forward
- BUser-controlled
- CChat-first
- Before the prototype
Screener
8 questions: role, vertical, size, tools
Same for every owner. No prototype on screen yet. Each owner will see one version only.
Before any version is shown
Qualifies owners Scenario intro
You run Hartwell. Think out loud.
Each owner sees one version only
Think-aloud from here onBackground
How do you track the business today?
No prototype on screen yet
verbal- In the prototype
T0First look
Look, no clicks yet. What is it for?
AWelcome screen, one Get started button
BChoose a starting point: goal cards
CKey metrics, suggested questions, chat box
verbal T1Getting started
First time opening it. Talk it through.
AWelcome, 3 questions, layout pick, AI builds
BGoal template picker, short load
CNo setup, straight to the welcome screen
1 to 7 easeT2Read the dashboard
How is Hartwell doing? What is missing?
AAI insight banner, Vitals, Key metrics
BAt a glance cards, Key metrics
COverview metric cards
1 to 7 easeT3Investigate a decline
Leads may be down. Find out why.
ANew Leads card → Detail modal, or Ask AI panel
BNew Leads card → Detail modal, or wand popover
C“Why are my leads down?” chip → answer card
1 to 7 easeverbalT4Make it your own
Change, add or rearrange anything.
ADrag and resize, and AI adds metrics and charts
BEdit Dashboard + Add widget drawer
CSave to Dashboard → Your metrics
verbalT5Use the AI
Find the AI. Revenue vs last month?
AHeader Ask AI side panel
BWand on a revenue widget, no global button
CThe chat itself, already home
1 to 7 easeT6Thirty-second check
Hectic morning: the one thing you’d check
Their own pick, on the version they had
verbal- After the prototype
Closing
Most useful alerts, and where you check
Same for every owner, after the prototype.
Same for all versions
multiple choice Usability scale
System Usability Scale (SUS), 10 items
Same for all versions
usability scale
What the screener filters for
- Decision authority, not just employment at a small business
- Reviews their own numbers, at some real cadence
- Business stage, from first hires to expansion, with solo operators screened out
- Service vertical, weighted toward home services
- Headcount and revenue band
- Tools already used, which doubles as context for the findings
- No one who had used the company's own product, so nobody judged a familiar tool
The testing platform needs at least one disqualifying answer per question, so every question has to filter. When I merged my screener with the organization's template, I dropped one of its questions as redundant. It was not, and it went back in verbatim.
The three versions
Each version gives control of the dashboard to someone different.
I kept everything else the same across the three versions, with one fictional business (Hartwell Home Services), the same numbers, the same visual system and identical rating questions.
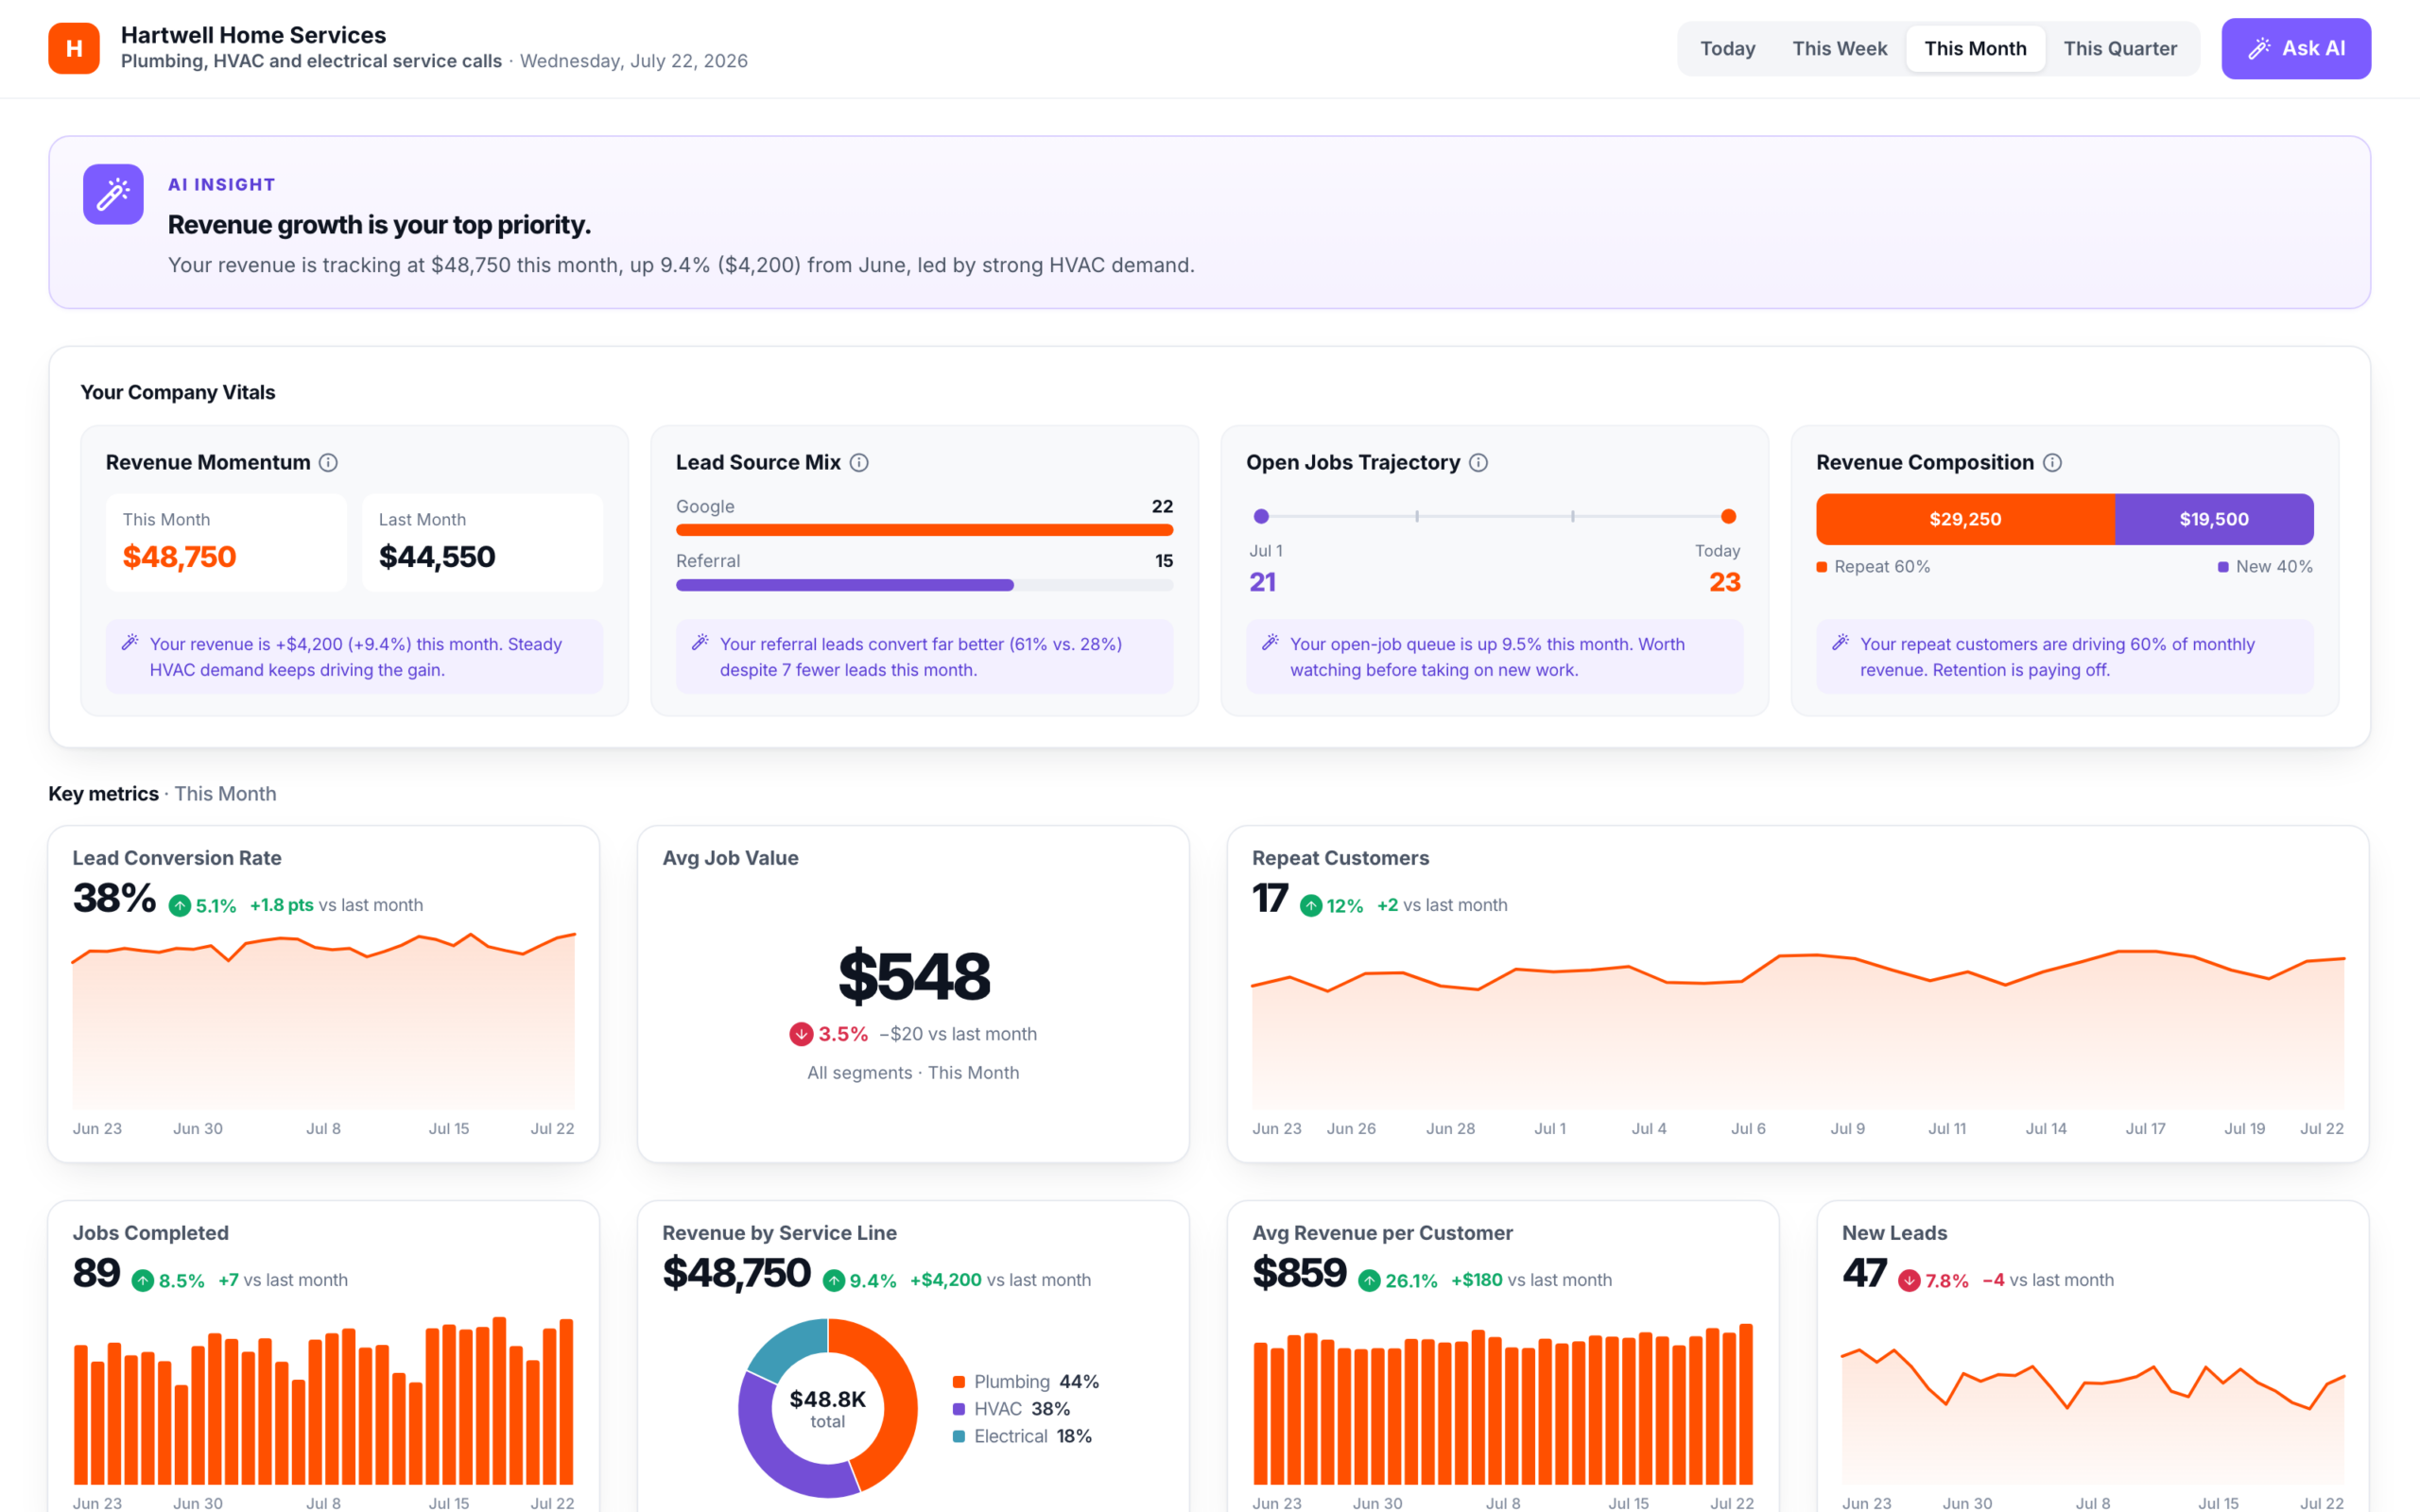
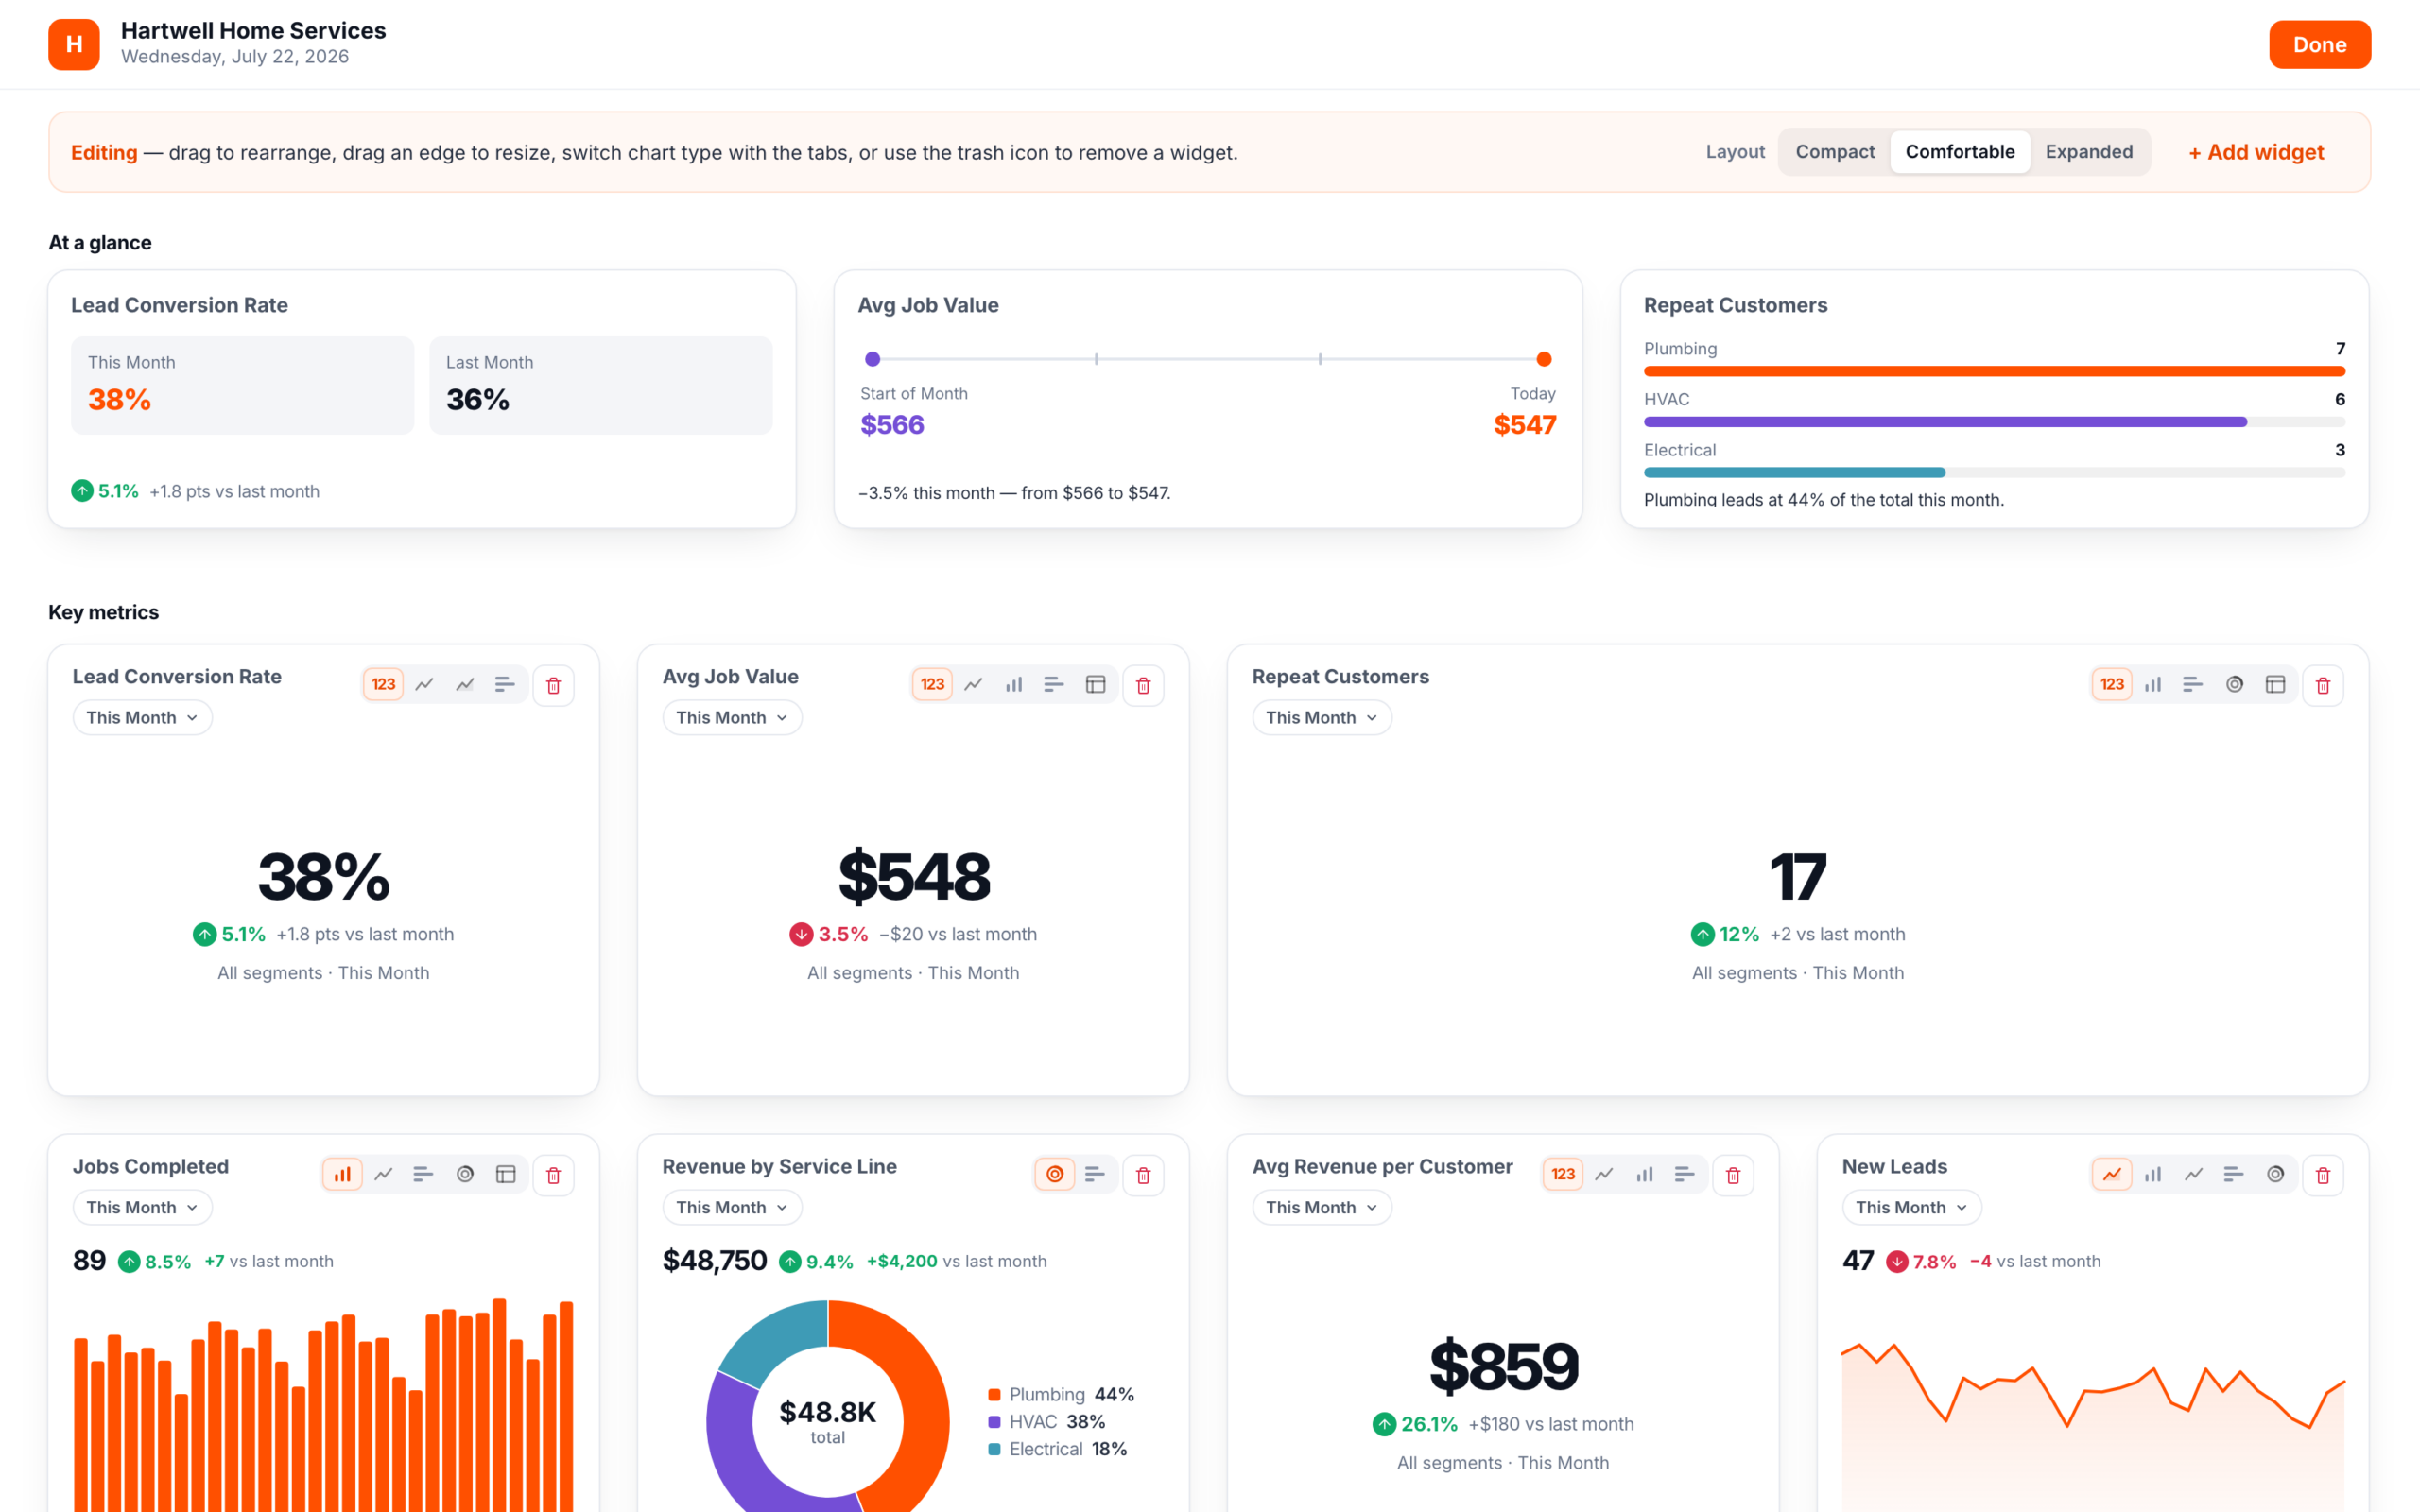
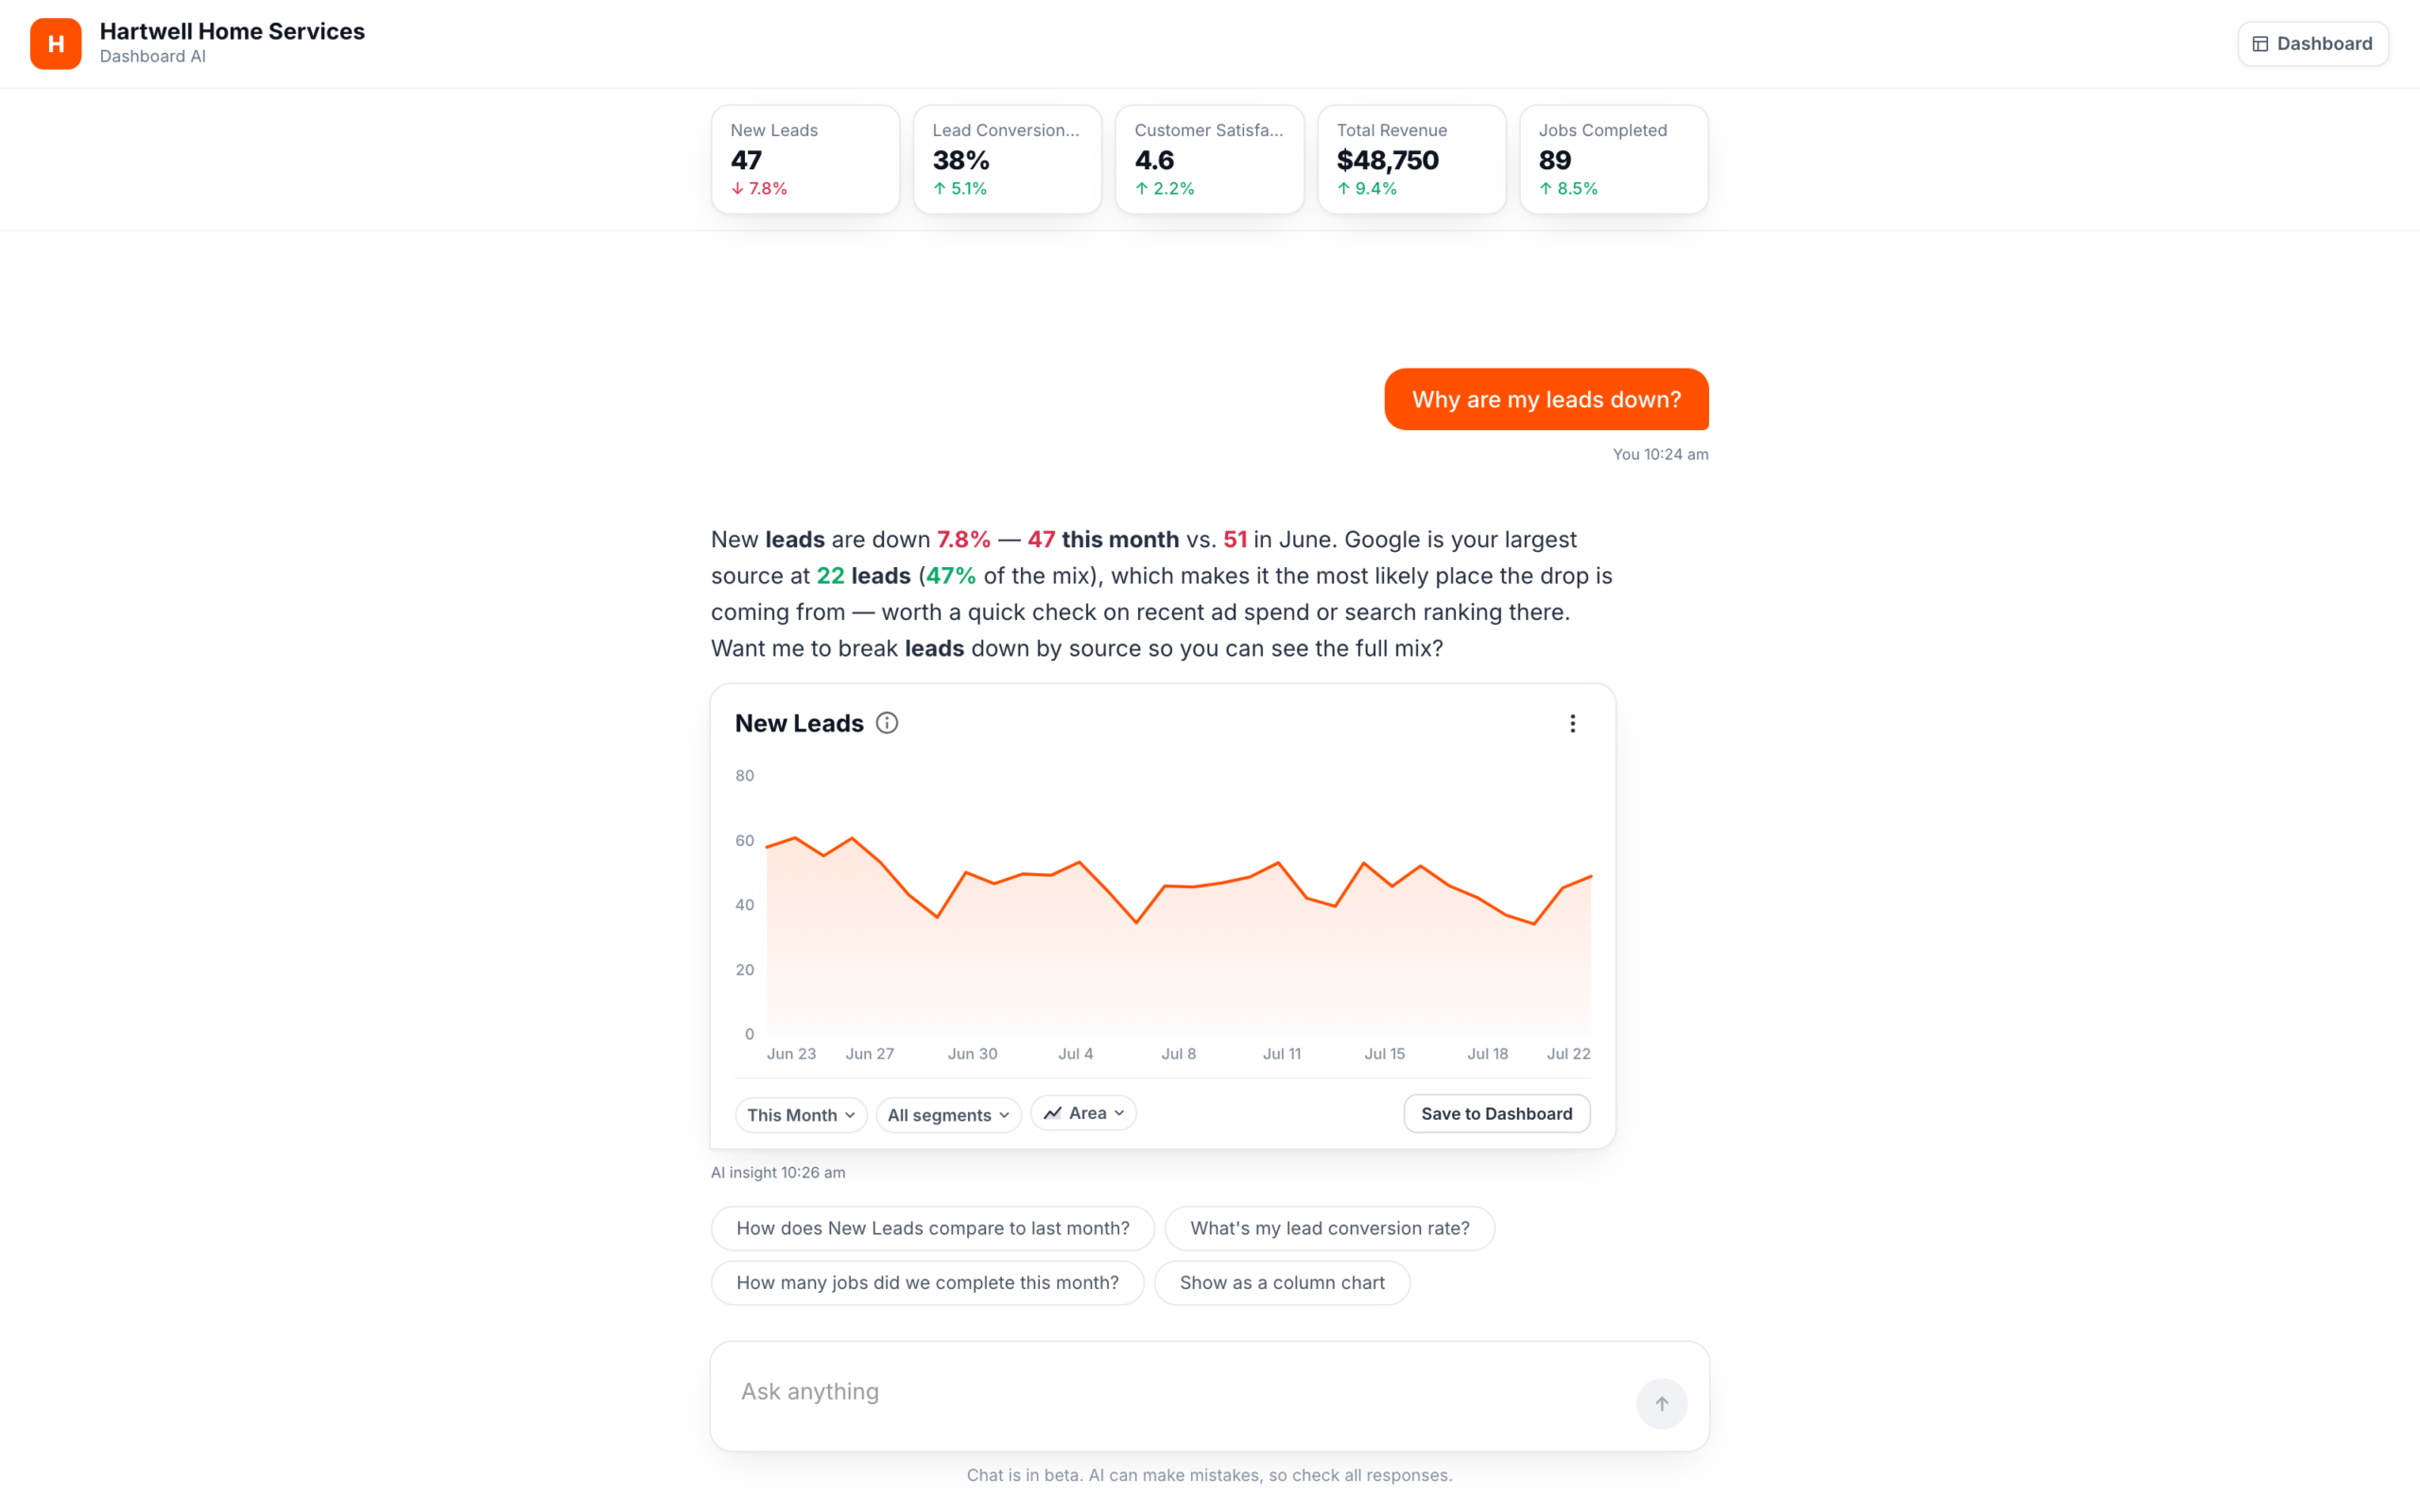
See the nine key screens of the three builds, wireframed
- 1
Step 2 of 4
What's the top priority for your business right now?
Growing revenueKeeping customers happyManaging my teamControlling costsA1Setup, step 2 of 4: a tap answers and moves on
- HThis MonthAsk AI
Hartwell Home Services
Plumbing, HVAC & electrical ·
23AI Insight
Revenue growth is your top priority.
Your Company Vitals
Revenue
MomentumThis Month$48,750
Last Month$44,550
Lead
Source MixGoogle22
Referral15
Open
Jobs TrajectoryJul 121
Today23
Revenue
CompositionRepeat 60%New 40%Key metrics · This Month
Lead Conversion Rate
38% 5.1%
Avg Job Value
$548 3.5%
Repeat Customers
17
12% vs last month
A2Dashboard: AI insight above the fold
- HThis Month
Hartwell Home Services
Key metrics · This Month
Revenue by Service Line
$48,750 9.4%
PlumbingHVACElectricalAvg Revenue per Customer
$859 26.1%
New Leads
47 7.8%
Performance
Revenue Over Time
Leads by Source
GoogleReferralRepeatSocial4Ask AI
Your Hartwell business assistant
How does Total Revenue
compare to last month?How many jobs did we complete?Total Revenue
$48,750 9.4%
LineAdd to dashboardAsk about your business…A3Ask AI panel: the dashboard narrows, answers can be added
- 1Setup is three questions plus a layout pick. One tap answers and moves on. There is no Back or Continue.
- 2The AI Insight banner follows the chosen priority. It is passive, not clickable, and never about leads.
- 3One global Ask AI button. Its side panel opens beside the dashboard, which narrows to make room.
- 4Adding a metric or changing a chart runs through the AI. Answer cards carry a chart pill and Add to dashboard.
- 1
Hartwell Home Services
Choose a starting point for your dashboard.
Pick the goal that matters most. You can customize everything after.
Grow Revenue
Track sales performance, leads, and conversion
Start with this →
Keep Customers Happy
Monitor satisfaction, retention, and follow-ups
Start with this →
Manage Operations
Stay on top of jobs, scheduling, and your team
Start with this →
Control Costs
Watch your expenses, invoices, and cash flow
Start with this →
B1Choose a starting point: four goal templates
- HEdit Dashboard
Hartwell Home Services
23At a glance
Lead Conversion Rate
This Month38%
Last Month36%
5.1%
Avg Job Value
Start of Month$566
Today$547
3.5%
Repeat Customers
Plumbing7
HVAC6
Electrical3
Key metrics
This MonthJobs Completed
89 8.5%
This MonthRevenue by Service Line
$48,750 9.4%
PlumbingHVACElectricalThis MonthNew Leads
47 7.8%
B2Dashboard view: a wand on every card, no global AI
- H
Hartwell Home Services
Editing
LayoutCompactComfortableExpandedJobs Completed
New Leads
Add a widget
Click to add, or drag onto the canvas to place it.
Total RevenueOpen JobsNew LeadsAddedCustomer SatisfactionJobs CompletedAddedOutstanding InvoicesAvg Job ValueAddedLead Conversion RateAddedRepeat CustomersAddedRevenue by Service LineAdded43Inset · view mode
This MonthNew Leads
47 7.8%
Ask AI
About New Leads
What's driving the change
in New Leads?Compare to last monthAsk a follow-up…B3Edit mode with Add a widget open, plus the wand popover inset
- 1Start from one of four goal templates. One click builds the dashboard. There is no confirm step.
- 2Edit Dashboard is the only header control, with no global Ask AI and no global period. Each card has its own period pill.
- 3AI is an icon-only wand on each card. Its popover anchors to that card and answers an automatic first question.
- 4Edit mode adds chart-type tabs, layout presets and a trash in the wand's corner. Add a widget lists every metric. Those on the canvas are dimmed and tagged Added.
- HDashboard
Hartwell Home Services
Dashboard AI
Good morning,
Your key metrics for this month,
New Leads
47
7.8% vs last mo
Lead Conversion Rate
38%
5.1% vs last mo
Customer Satisfaction
4.6
2.2% vs last mo
Total Revenue
$48,750
9.4% vs last mo
Jobs Completed
89
8.5% vs last mo
How is revenue trending?Why are my leads down?Show my conversion rateHow many jobs did we complete?1Ask anythingChat is in beta. AI can make mistakes, so check all responses.
C1Welcome: no setup, chat is the home screen
- HDashboard
Hartwell Home Services
Dashboard AI
New Leads47 7.8%
Lead Conversion Rate38% 5.1%
Customer Satisfaction4.6 2.2%
Total Revenue$48,750 9.4%
Jobs Completed89 8.5%
Why are my leads down?
7.8% 47 51 22 47%
New Leads
This MonthAll segmentsAreaSave to DashboardAI insight
How does New Leads compare to last month?Show as a column chart23Ask anythingChat is in beta. AI can make mistakes, so check all responses.
C2Chat answer: a paragraph plus a live insight card
- HDashboard
Hartwell Home Services
Dashboard AI
Your metricsThis Month← Back to chat34Your overview
New Leads
47
7.8% vs last mo
Lead Conversion Rate
38%
5.1% vs last mo
Customer Satisfaction
4.6
2.2% vs last mo
Total Revenue
$48,750
9.4% vs last mo
Jobs Completed
89
8.5% vs last mo
Your dashboard
New Leads
47 7.8% vs last mo
All segmentsAreaLead Conversion Rate
38% 5.1% vs last mo
All segmentsLineC3Your metrics: saved answers become the dashboard
- 1No setup. Chat is the home screen, with five overview cards, four starter questions and one input.
- 2Answers come back as a paragraph plus a live insight card with period, segment and chart pills.
- 3Save to Dashboard is how the dashboard gets built. Saved cards collect in Your metrics.
- 4One period picker drives every card in Your metrics. Back to chat returns to the thread.
New Leads
Detailed breakdown
47 7.8% vs last month
Worth a look
Trend · This Month
By service type
Plumbing21
HVAC18
Electrical8
ModalOpened from a card or panel in A, a card body in B, an overview card in C
- 1One drill-down for all three shows value, change against the prior period, and a Worth a look note when a metric declines.
- 2Period tabs plus Pin to top, which adds a pinned row in A and B.
- 3Ask AI about this… is scoped to the open metric and period.
Who can change what, version by version
| Control | A · AI-forward | B · User-controlled | C · Chat-first |
|---|---|---|---|
| Reorder | Drag, always on | Drag, in Edit mode | Drag, in Your metrics |
| Resize | Drag an edge | Drag an edge, in Edit mode | Drag an edge, in Your metrics |
| Chart type | Only by asking the AI | Direct chart-type tabs on each card, in Edit mode | A chart pill, or a "Show as" chip |
| Period | One period bar for the page | A pill on each card | A pill on each card, plus one master picker |
| Add a metric | From an AI answer card | Direct an Add widget drawer | Save to Dashboard on an answer |
| Remove a metric | Only metrics added through chat | Trash, with Undo | Remove on a saved card |
| Density | Chosen once, in setup | Compact, Comfortable or Expanded | None |
From the tested prototype's code. Control moves from the AI in A, to the owner in B, to the conversation in C.
The build
I built all three versions as one React app on a live AI service.
In the first round of Ask Thryv, my AI chat project that ran alongside this one, one wrong scripted reply was enough to change how people felt about the feature. Every question an owner typed or tapped went to a live model, Claude, through a service I built and deployed for the study.
Architecture of the study build: the dashboard's shared data layer holds the numbers every widget shows. A seeded dataset with 2 years of synthetic history was calibrated to match it and feeds the live AI service. An audit checks every figure the AI's tools return against every dashboard figure, and the build was held to zero direction flips. The data layer and the AI service both feed three working prototypes, built on Thryv's design system components through its MCP server and served from one hosted build, which 53 owners used in study sessions on UserTesting.com, one version each.
Built end to end with Claude Code: three versions on the design system's MCP server, the AI service and the audit
Seeded dataset
2 years of synthetic history for one fictional business
Shared data layer
The numbers every dashboard widget shows
Audit: every number the AI's tools return vs every dashboard figure, 4 periods: up or down must match, after every change
0 direction flips
Live AI service
Claude · 21 lookup tools
Express · TypeScript
System prompt: Told to call a tool before stating any number
Scripted fallback if the model stalls
Hosting: Deployed to Thryv's cloud sandbox through the company's own pipeline · infrastructure managed by IT
Three working prototypes
One hosted build, switched by ?s=1, 2, 3
AVersion A: AI-forward
Setup questions, then a dashboard built around the answers
BVersion B: User-controlled
Pick a goal template, then drag, resize and switch charts
CVersion C: Chat-first
Ask in chat, then save answers as cards
Thryv's design system components, via its MCP server
One chart renderer · 18 chart types
Study sessions
on UserTesting.com
53
owners, one version each
About 2 months, discovery to final report
- First prototype commit
- AI service begins
- Two unmoderated study waves
- Final report
I had to make the AI agree with the dashboard.
In the first pass, the AI confidently reported a metric rising while the widget beside it showed the same metric falling. A reporting tool can't have that bug. They read different data. With no real customer data, and Thryv's data team still building one trusted source, the dashboard showed sample numbers and the AI read a sample dataset I generated, with 2 years of history so it could answer for any period.
I wrote an audit script that compares every number the AI's lookup tools return with the matching dashboard figure, across 4 periods, and I ran it after every change. It had to find zero cases where one said up and the other said down. I checked its written answers by hand.
- Research and the report. Deep research to start, and a first draft of the final report, which I edited through a few rounds.
- Building. I built the three versions, the AI service and the audit script in Claude Code, with components from the design system's MCP server.
- Checking. AI read the plan, script and code together and flagged two task premises the build could not support. I confirmed both and rewrote them.
I set the hypothesis that the real variable is who decides what the dashboard shows. I decided what each version was built to test and wrote every task premise. AI let me build and check more than I could alone.
What deploying it taught me
- A 200 response did not mean it worked. The service falls back to a polite reply by design, so it returned that fallback for six straight tries while a key was misconfigured.
- The browser path needed its own test. The endpoint worked from the command line while every real browser call was blocked by a CORS setting nobody had set.
- A request with no timeout could stall a session. In the tested build, an AI request that never came back left an endless spinner in a dimmed detail view. After the first wave, I made every call give up after 9 seconds and fall back to a scripted answer.
Testing
53 owners each tested one version, in two unmoderated waves.
Owners used the dashboard on UserTesting.com and thought out loud.
Participants
Who took part
- 9service verticalsOwners screened from home services to dental offices and fitness studios
- 60recruited8-question screener, two waves
- 7excluded3 by a Version B screen freeze
- 53analyzedEach saw one version
- 43completed the usability scaleA18B13C12
Every owner got the same task, to find out why leads might be down.
Each version offered its own routes to the cause. Owners often missed A's drill-down and found B's AI wand late, so those two features were hard to judge.
See every path through the leads task
Task flow diagram. From the prompt that leads might be down vs last month, it maps every route each version of the tested prototype offered, ending at a cause named, or not.
Leads might be down vs last month
AAI-forward
In the codeThe AI Insight banner is about the chosen priority. It never mentions leads.
Drill-down: appreciated when found, not consistently discovered.
BUser-controlled
In the codeNo global Ask AI button. Each card has an icon-only wand.
The wand: discovered late, and read as an edit control.
CChat-first
Suggested questions reduced blank-slate anxiety.
tap chip or typeNaming the source was the highest-trust moment.
follow-up chip- Screen
- AI surface
- Step to a screen
- Step to an AI surface
- Decision
- Note from the study report
- Note from the code
A cause named, or not
After the first wave, I fixed the AI so it could explain why leads dropped.
In the first wave, the AI could not say why leads fell, because its lookup tool returned this period only. Between waves I gave the tool last period's counts for every source and told the model to name the part that changed most as the likely cause. In the second wave, it named Google.
One question, traced through the live AI
-
The owner asksReact prototype
Why are my leads down?
Version C · suggested question
-
Claude picks a toolExpress service + Claude
tools 21
- get_revenue
- get_open_jobs
- get_leads_by_source
- get_avg_job_value
- get_outstanding_invoices
- +16 more+20 more
tool_use
Tool call: get_leads_by_source, period This Month.21 lookup tools. The model is told to call one before stating any number.
-
The service answers from dataExpress service, seeded data
tool_result excerpt
Tool result excerpt: 51 leads this month, 69 the month before, down 26.1 percent. Google 26, down from 41 (51 percent of leads). Referral 17, up from 15. Repeat 6, down from 12. Social 2, up from 1. -
The answer, groundedReact prototypeAI
Figures cited in the answer: 51 new leadsdown 26% vs last monthGoogle: 41 to 26
- Looked it up before stating it
- Uses the time range on screen
- From a widget? Assumes that metric
- Out of scope? It says so and offers what it can
- No reply in 9 s? A polite fallback
- Likely driver, not proven cause
Findings
Owners wanted a sensible dashboard to start from, then to move things around.
B led by only about 5 points, so I leaned on what owners said and did.
Owners who moved widgets around started talking about the dashboard as their own, and arranging it themselves produced the strongest intent to return. Nobody wanted to start from a blank canvas, though.
I do not want to design a dashboard. I want to approve one. Give me something sensible and let me move the pieces.
87.4"Excellent" band18 people
- Worked
- It felt like a business partner.
- Broke
- Some found the setup prompts ambiguous, and the drill-down was often missed.
- Risk
- People took its numbers on trust, so a confident wrong number would go unnoticed.
92.7"Best imaginable" band13 people
- Worked
- It made people proud of their dashboard.
- Broke
- Several people read its icon-only AI button as an edit control, and it was often found late.
- Risk
- Customization costs effort, so B leaned on its goal templates.
87.7"Excellent" band12 people
- Worked
- The study's biggest highs. Suggested questions meant nobody faced a blank page.
- Broke
- It did not always honor formatting requests, and several people found saving by accident.
- Standout
- "I knew Google was important but not that important. That number changes how I allocate my budget."
Usability (SUS) scores from 43 of the 53 owners, with 12 to 18 people per version. The line on each bar is the industry average of 68. Every session ran on desktop, so mobile was never tested.
- 01
Version A's insight strip was the most trusted AI in the study.
In Version A, the AI generated an insight for each owner's chosen priority and showed it on the dashboard, before they asked anything. Its placement and specificity earned owners' trust. Owners forgave a gap in accuracy more readily than vagueness, which made them doubt the data. Ignored formatting requests and repeated replies also hurt trust. As one Version C owner said: "It felt like it was not really listening."
- 02
Owners preferred simple line and bar charts.
Owners read line charts without hesitation, and bar charts worked for comparisons. Donut charts caused consistent hesitation. One Version C owner said: "Put the number in the middle, put the label outside. Do not make me guess." The highest-rated customization was simply changing the chart type.
Owners trusted AI that was specific and showed up where they were already looking, so in the hybrid each insight stays on its card, with a See breakdown link to the numbers behind it.
What came next
For the next round, I recommended a hybrid built on B.
B scored highest, but the strongest parts of A and C held up too. Larger operations leaned toward B and smaller teams toward A.
A rough concept wireframe of the study's recommendation for the next round: a hybrid built on B.
- Foundation from B: layout control and chart-type switchingCards you drag, resize and switch chart type on, with a Lock layout toggle. Every card has a labeled Ask AI button and a See breakdown link, and a card with a big change offers "Why is this changing?"
- The way in from A: setup questions and the insight stripGuided setup you can re-trigger, then the AI insight strip at the top with a persistent Ask AI text entry under it.
- Depth from C: chat, when you want itAn optional side panel with suggested questions that follow the data, such as "Why are my leads down?", a year-over-year prompt, and a choice of text, table or chart answers.
Needs from the report
- 1Year over year, the most requested missing feature
- 2Let people choose text, table or chart answers
- 3A clearer save cue (the report found saving was often discovered by accident in C)
- 4An AI entry that is not mistaken for an edit control (open problem, not solved)
Where it stands · November 2026
Handed to product
The research and the prototype went to product as core input for the coming dashboard redesign. Nothing has shipped, and I left before the redesign was built.
The redesign starts from what owners told us. They want a familiar dashboard they control, AI they can call up when they need it, and insights in place on the screen.
- Study53 owners, Jul to Sep 2026
- Final reportSeptember 2026
- HandoffReport and prototype, where it stands now
- RedesignProduct's next step
- Product
- Thryv's Head of Product asked me for this research. The prototype build lives in the Product team's GitHub repository, and the tests and final report are in Confluence, with links to every doc.
- Chart library
- I kept building the same charts for these prototypes, so I turned them into a shared chart library. Other designers pulled it into their own prototypes, and engineering used it for Ask Thryv instead of the outdated charts.See the chart library (opens in a new tab)
Looking back
Building three separate versions was worth the extra work.
Three distinct products cost far more to build than one product with a feature toggled, and they are the reason the comparison means anything. It also let the hybrid I recommended keep what worked in each, with setup from A, layout control from B and chat from C.
Next time I'd check how much each number changed, not just which way.
My audit caught any case where the AI and the dashboard disagreed on up or down, but not on how much. For this month's leads, the card said down 7.8% and the AI said down 26%. I'd also have both read from one data source.