Enhance usability.
A visual, table-based UI with drag and drop and inline edits, to cut creation time at every skill level.
Result
Under 5min per metric
Users said their tasks got simpler.


Mosaic · Self-serve metrics case study
Mosaic users can build custom metrics by dragging fields into a table, or by writing a formula.
Building one used to mean writing code-like formulas. As design lead, I designed the drag and drop builder, and metric creation time fell from an average of 12 minutes to under 5.
The problem
Mosaic's pre-built metrics couldn't handle custom queries. Building your own meant formulas buried in data management settings, so use stayed low.
Bar chart, average time per metric, by skill level: Beginner 18 minutes, Intermediate 11 minutes, Advanced 8 minutes. Beginners took 10 minutes longer than advanced users.
Beginners found the existing tools hard to learn, and preferred visual editors even to syntax they knew.
of interviewees preferred a visual, inline, drag and drop UI
They saw a change to the original metric or report as a critical flaw in SaaS reliability.
Reporting and analysis each reached metrics in a different way.
A quarter of feedback was about these disjointed experiences
Mosaic's pre-built metrics were too rigid for custom queries that fit different business needs. Competitors offered similar tools, but their UIs were clunky and missed the chance for intuitive interactions.
The 30-second read
Beginners leaned less on support, and experts kept their formulas.
My role: I was the design lead at Mosaic, a strategic finance platform. I led Metric Builder with developing designers, engineers, project managers and subject matter experts (SMEs), and owned the research, personas, journey map, wireframes, high-fidelity mocks, prototypes and user testing.
Three metrics get built, by dragging, by pivoting and by formula.
Research
People knew Excel and Sheets, but neither could nest metrics.
Design influence: Led to the visual interface and a streamlined workflow, so building a metric is quick and dependable.
Way inDrag and drop
Design influence: Shaped inline editing, metric nesting and non-destructive edits.
Way in= Formula
I reviewed tools like Excel, Google Sheets, Looker, Tableau and Trevor.io, and found gaps in flexibility and ease of use. Most BI tools leaned on spreadsheets for entry-level users, which pointed to a hybrid with custom syntax for advanced users and a visual UI for beginners.
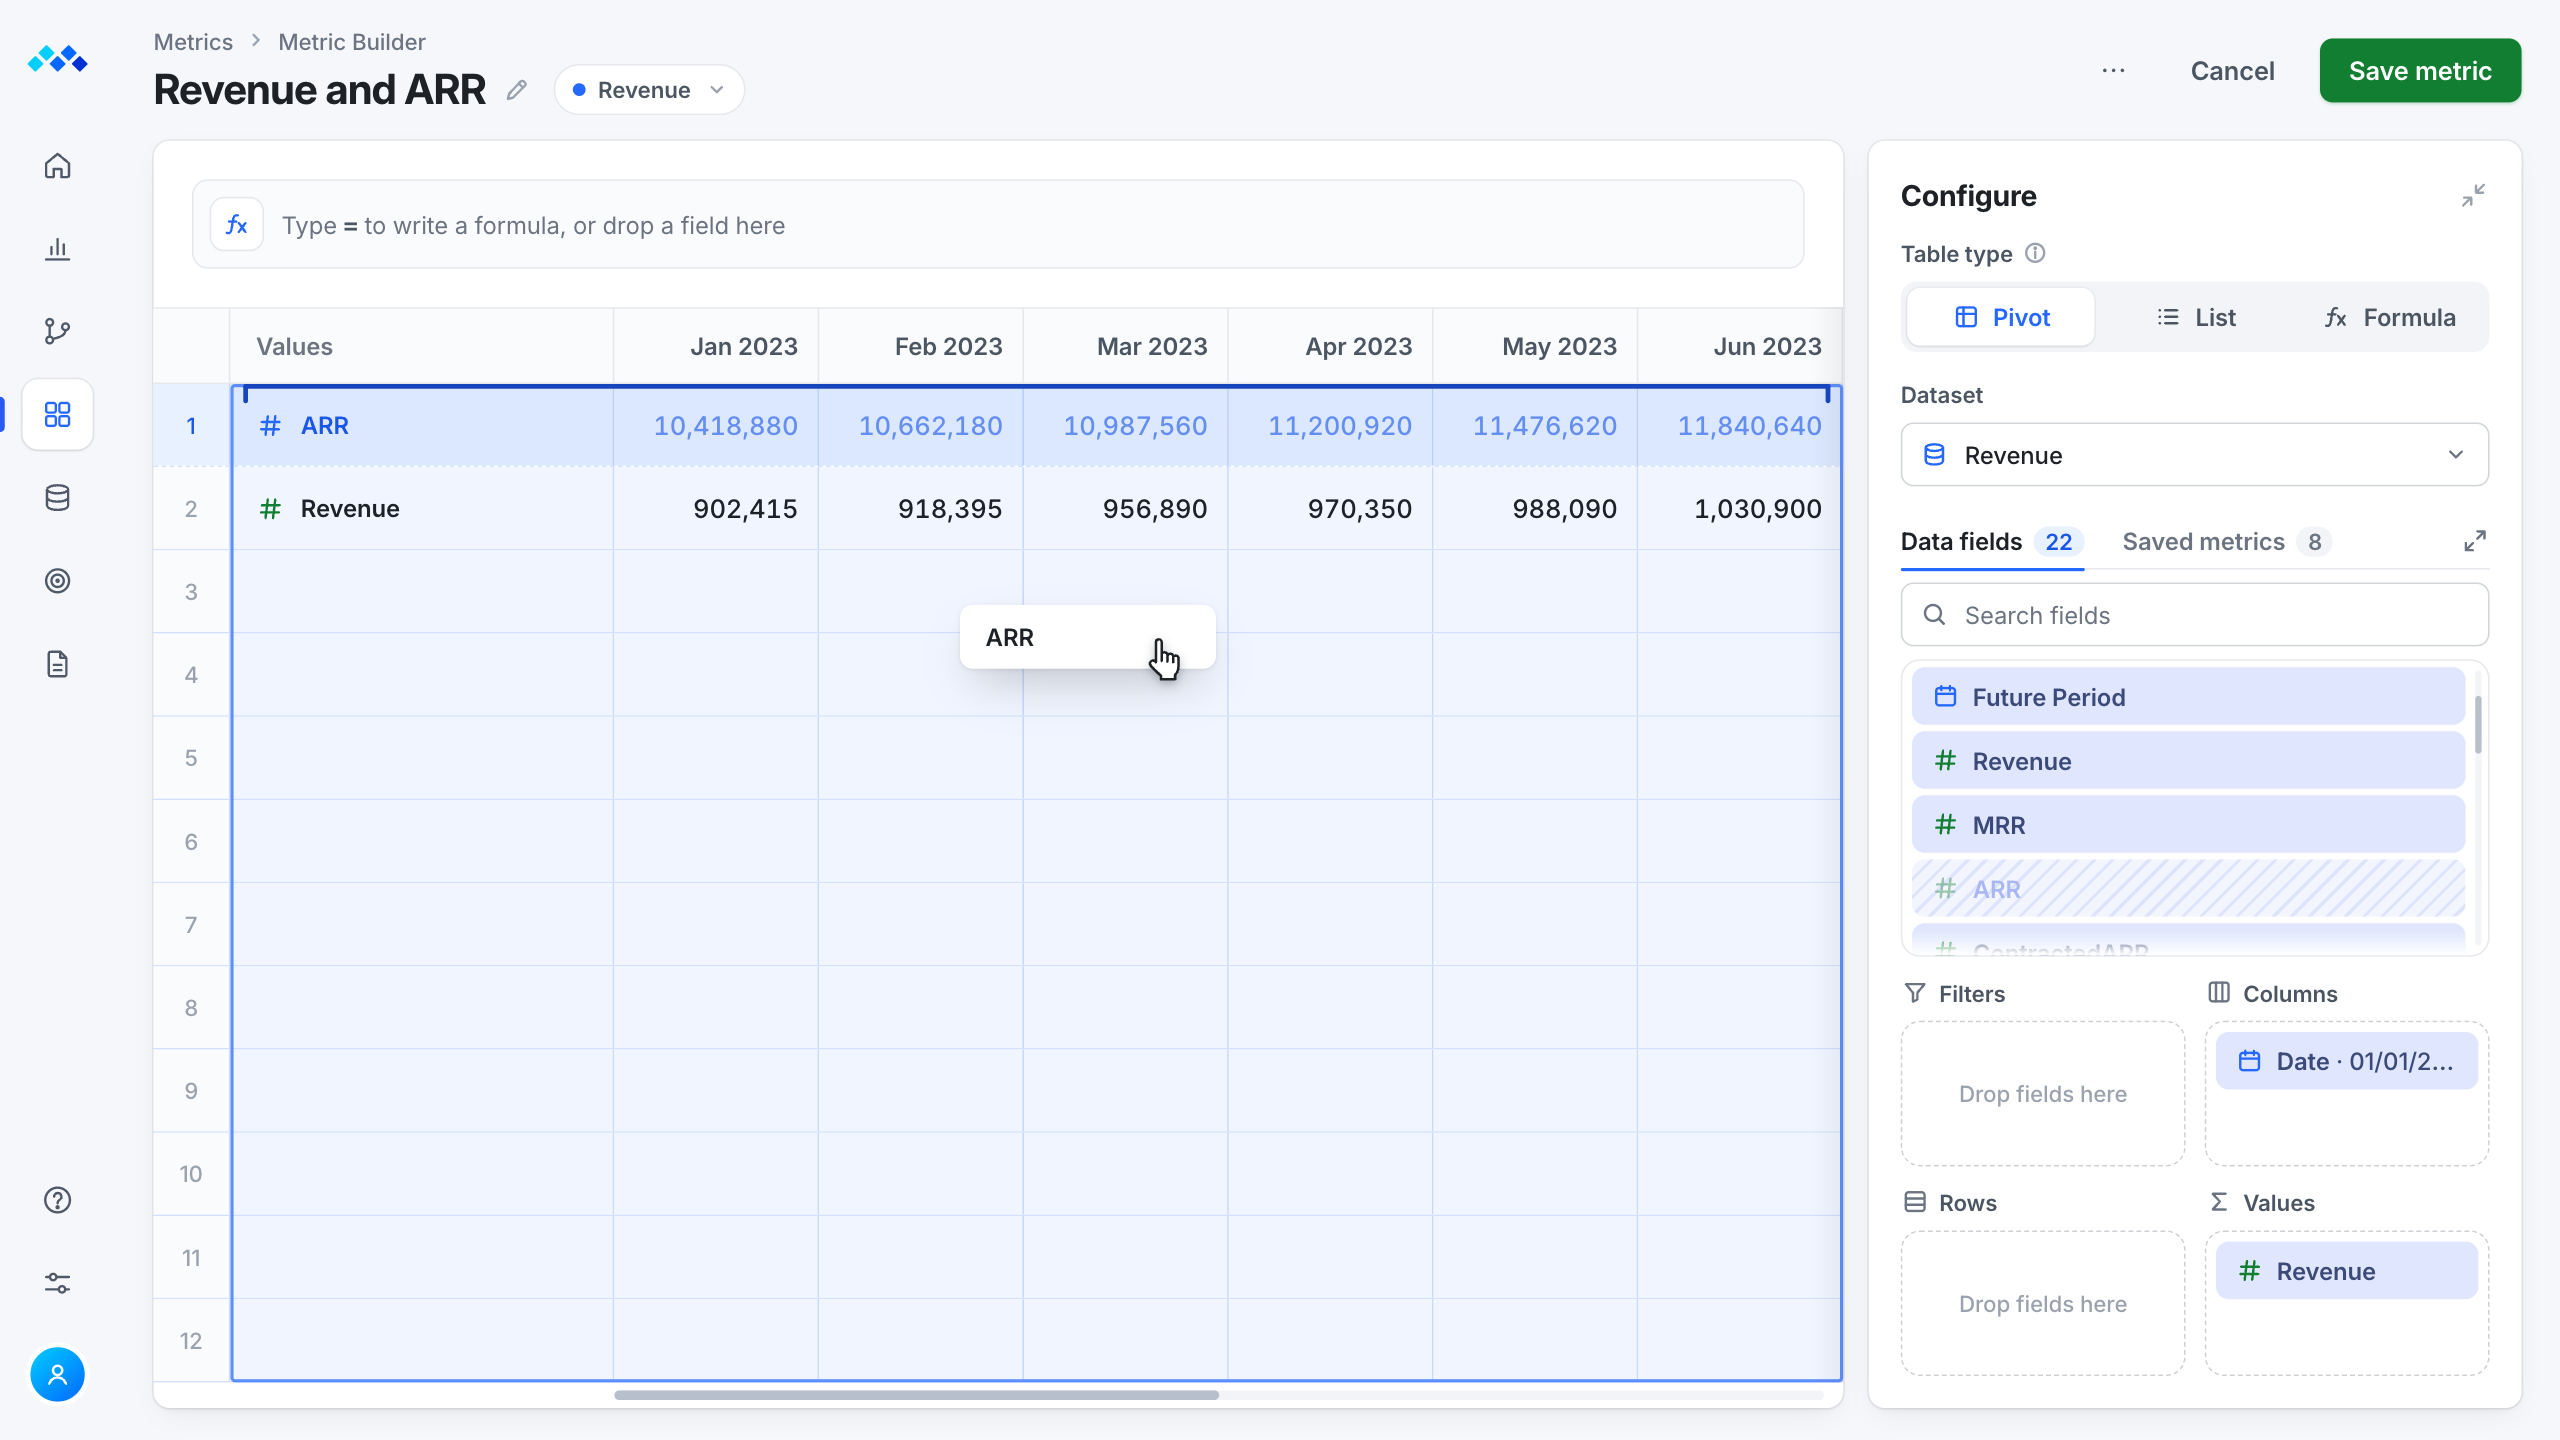
Two ways into the same metric. A beginner drags the ARR field into Values, and an expert types the formula equals MRR times 12. Both build the same row: ARR, 10,418,880 in January 2023, 10,662,180 in February and 10,987,560 in March.

 Spreadsheets
Familiar, but no advanced SaaS nesting.
 BI tool
Users found the UI clunky for non-technical people and teams, with limits on custom metrics and nesting.
 BI tool
Strong on data visualization, but it cost more, took longer to learn and limited custom metrics and nesting.
 Ad hoc queries
Non-technical users preferred it for ad hoc queries, citing Looker's complexity.
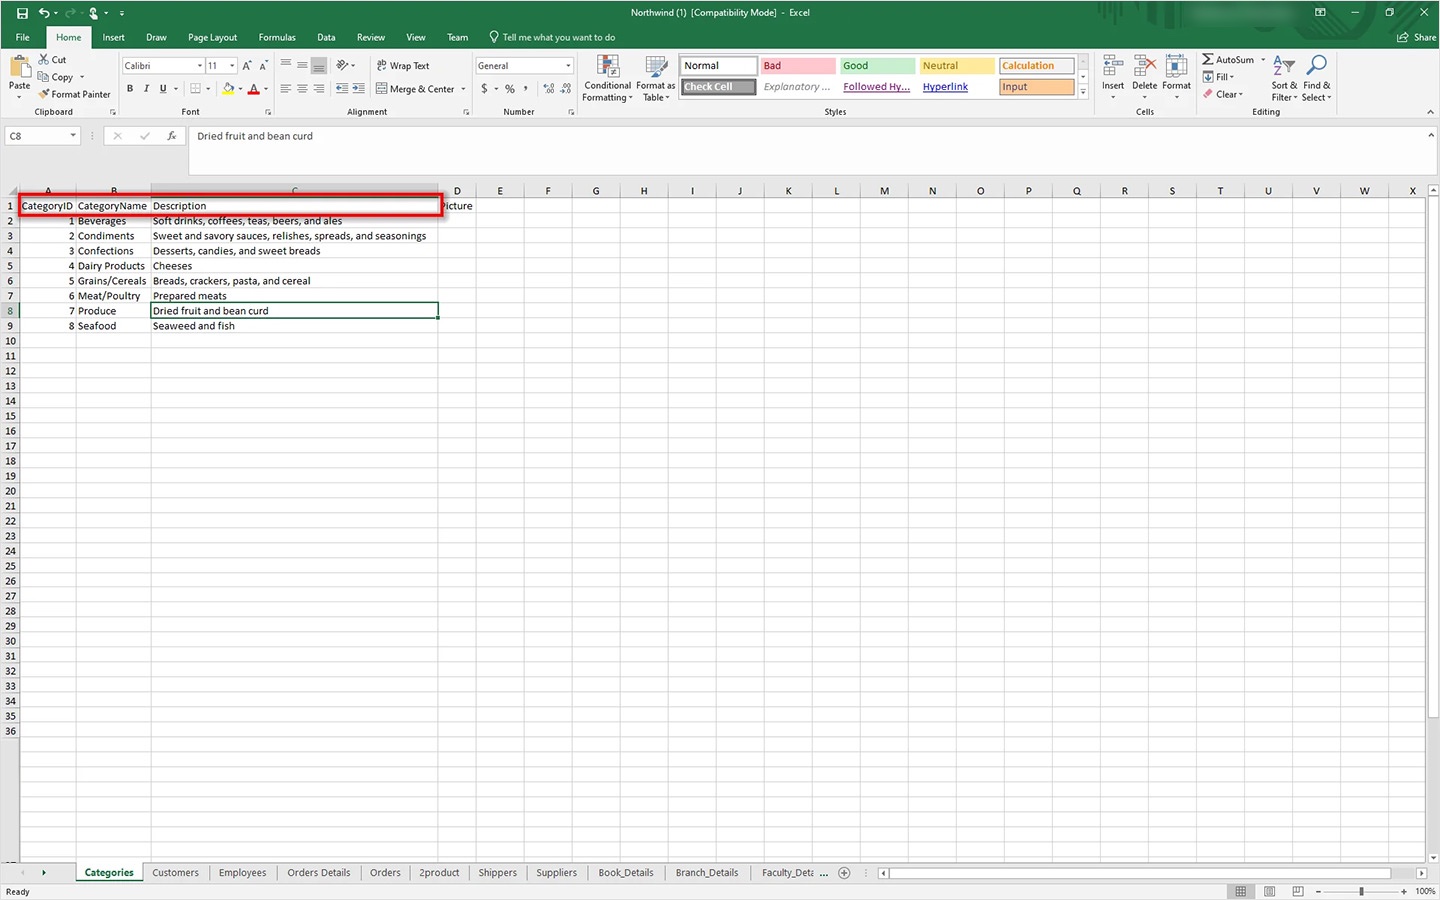
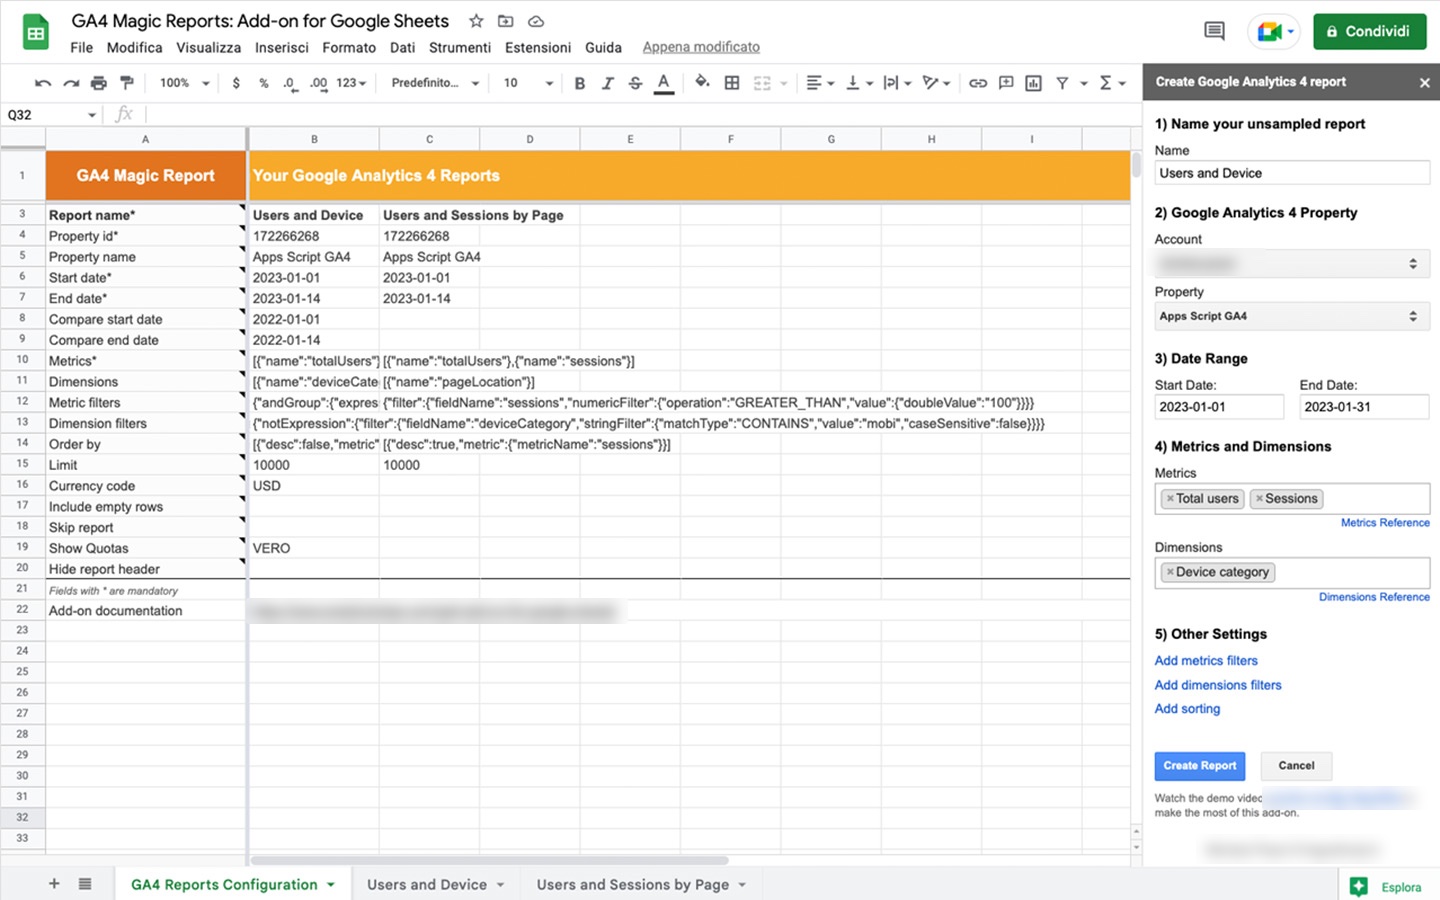
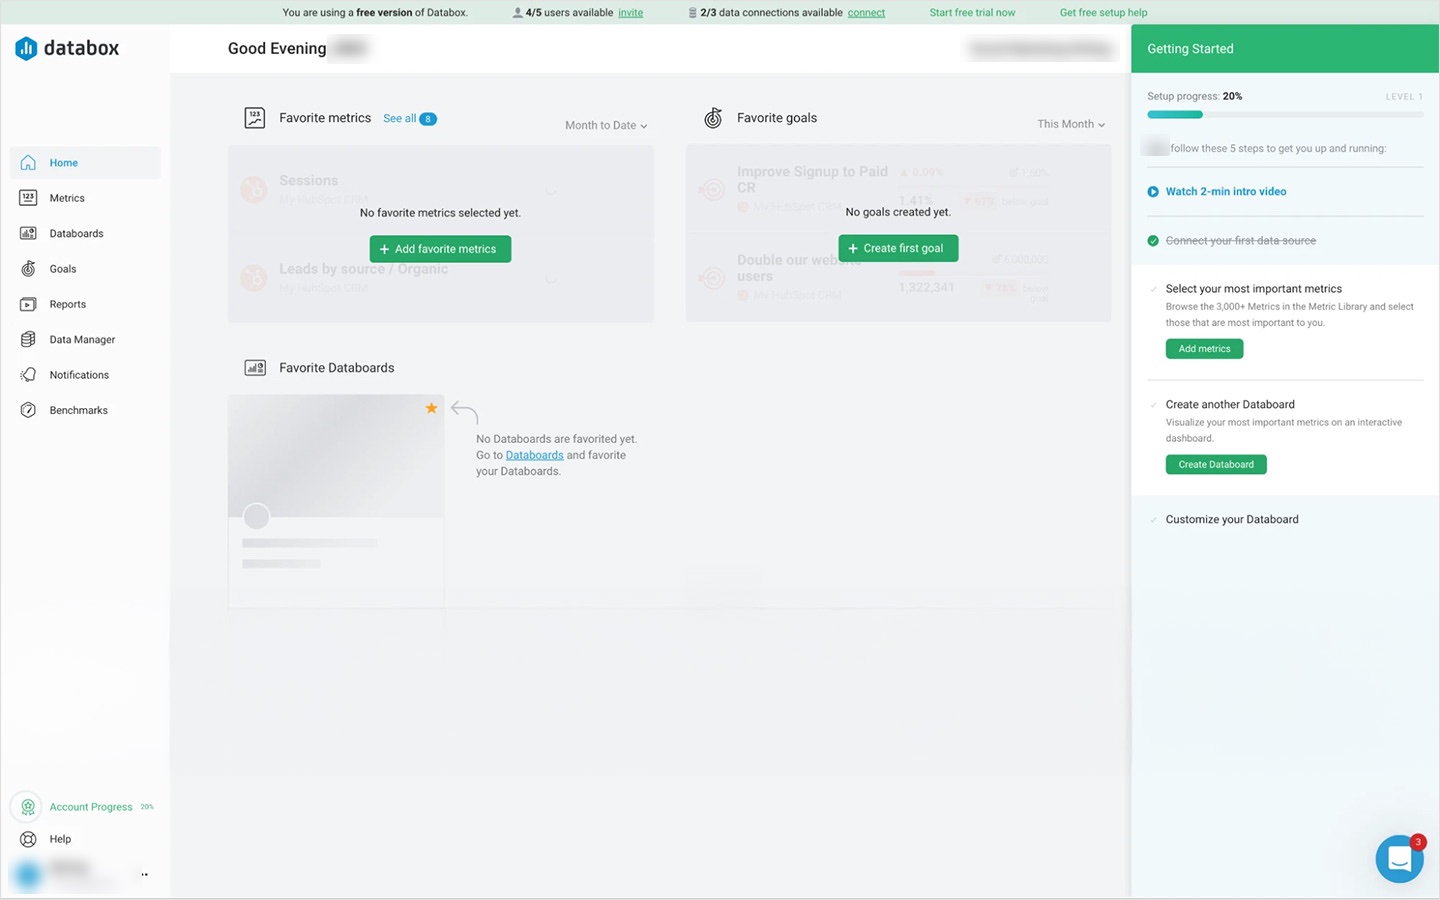
Screenshots from my review, with people's names, emails and account names blurred.
Journey map
One edit had to show up in reporting, data management and analysis.
What my journey flow protected. One change in Metric Builder, the Opportunity Amount metric filtered from all statuses to Open and saved, updates Reporting, Data management and Analysis together: the report row, the metric list and the chart all show the Open amounts, from 642,300 in January 2023. The map also kept nesting consistent, kept edits non-destructive and flagged upgrades and scope. Two edge cases were caught before development: an invalid formula, underlined with a message about a missing closing parenthesis, and two people editing the same metric at once.
Design
You can build without a formula, and reuse a metric without changing the original.
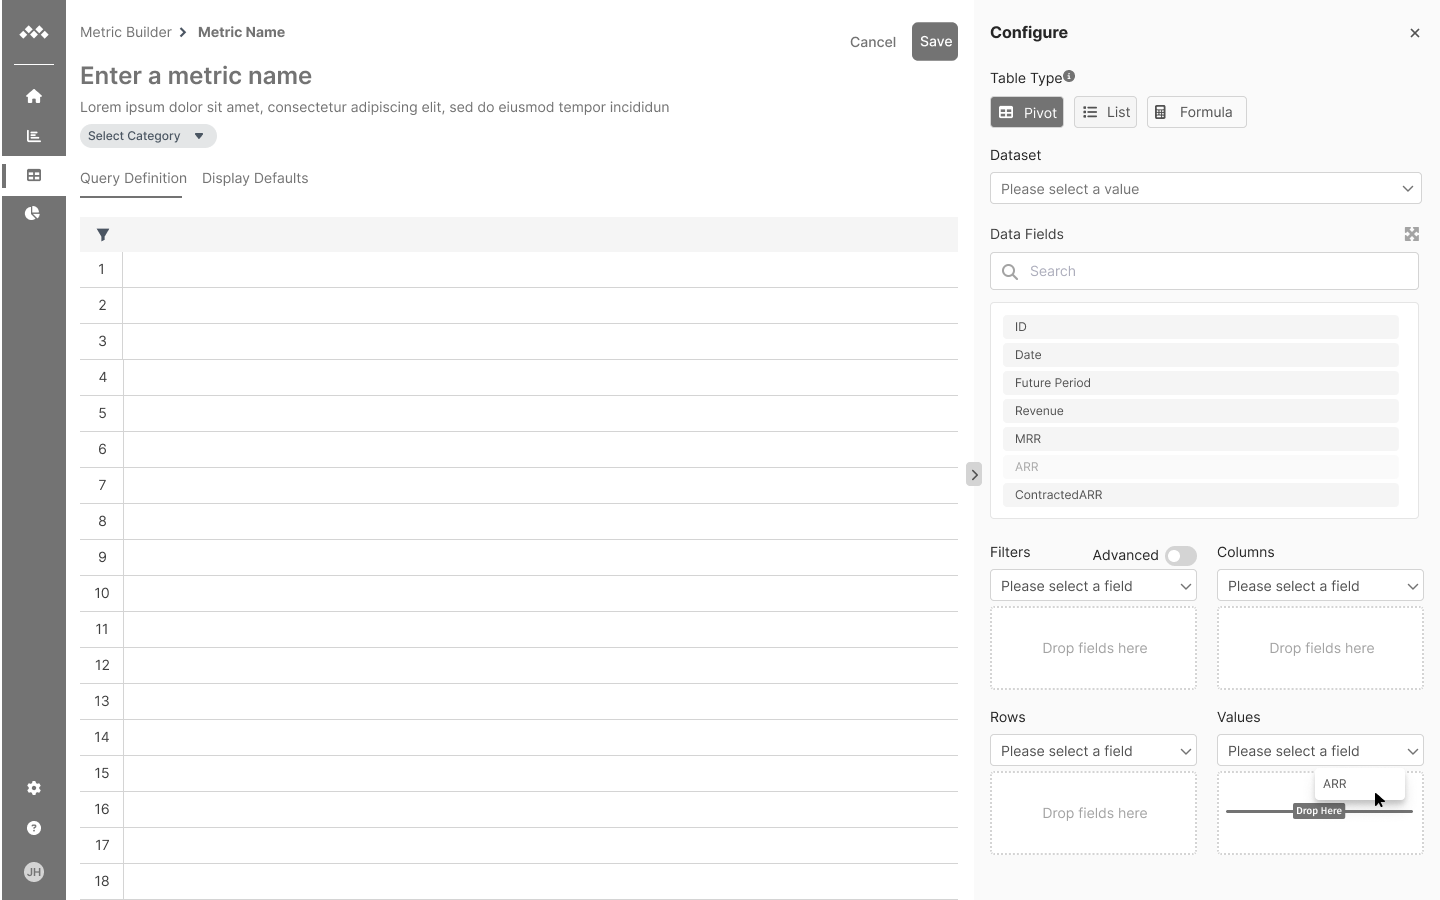
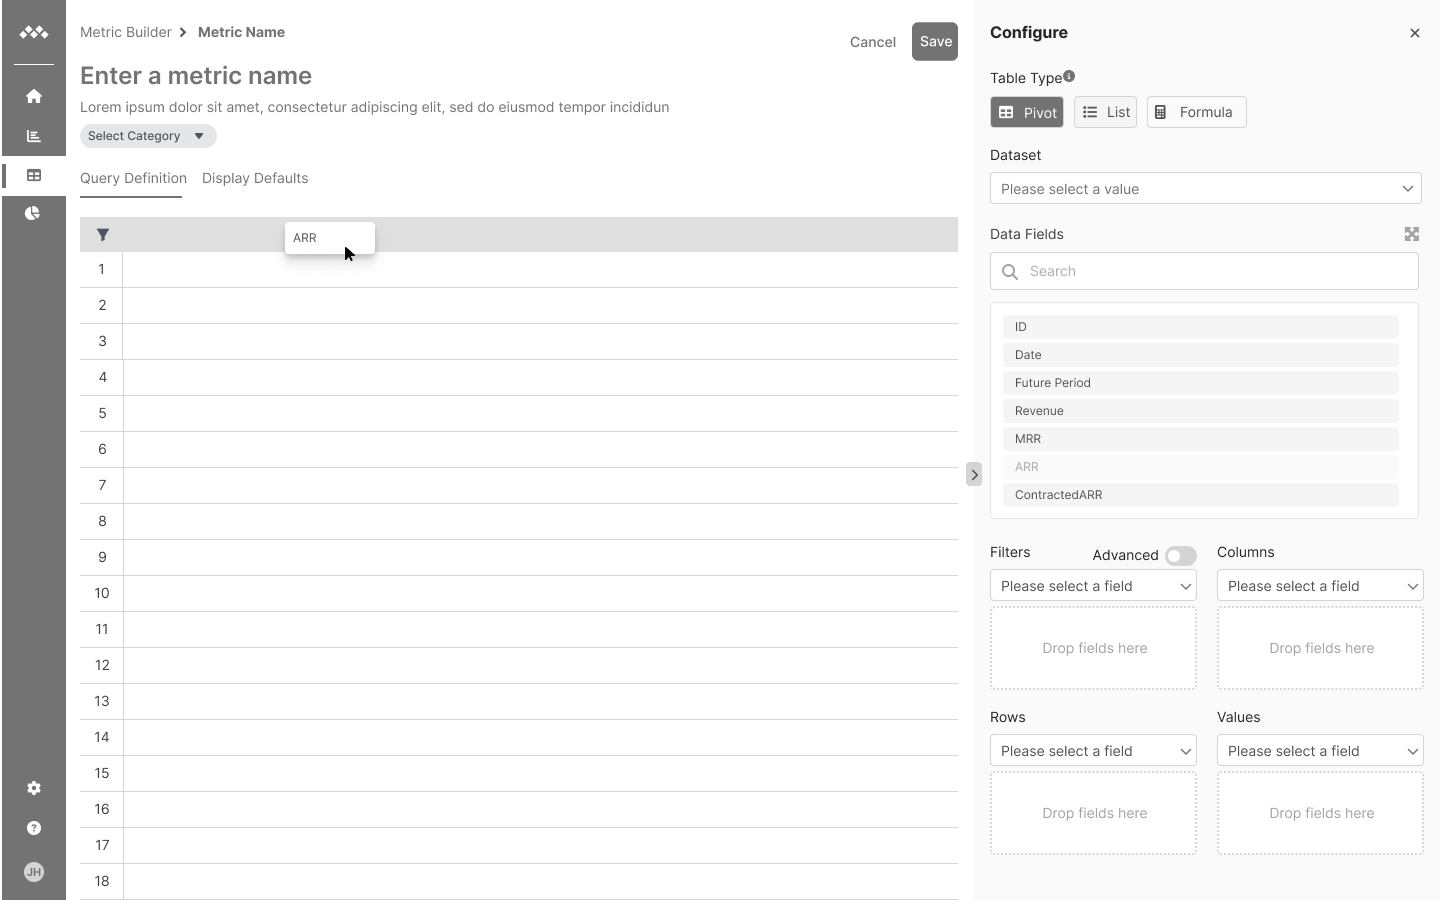
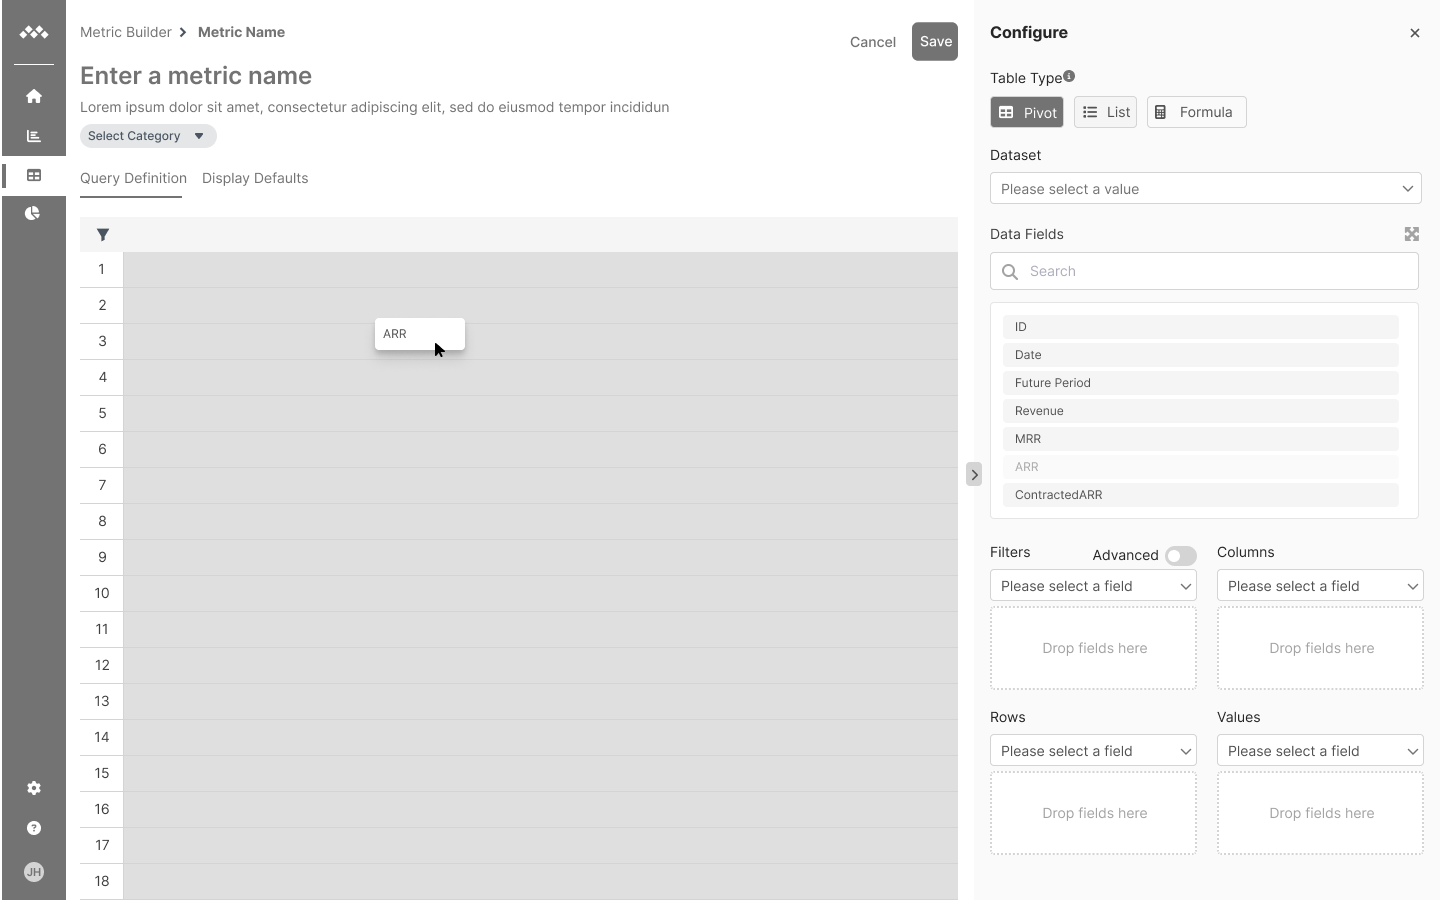
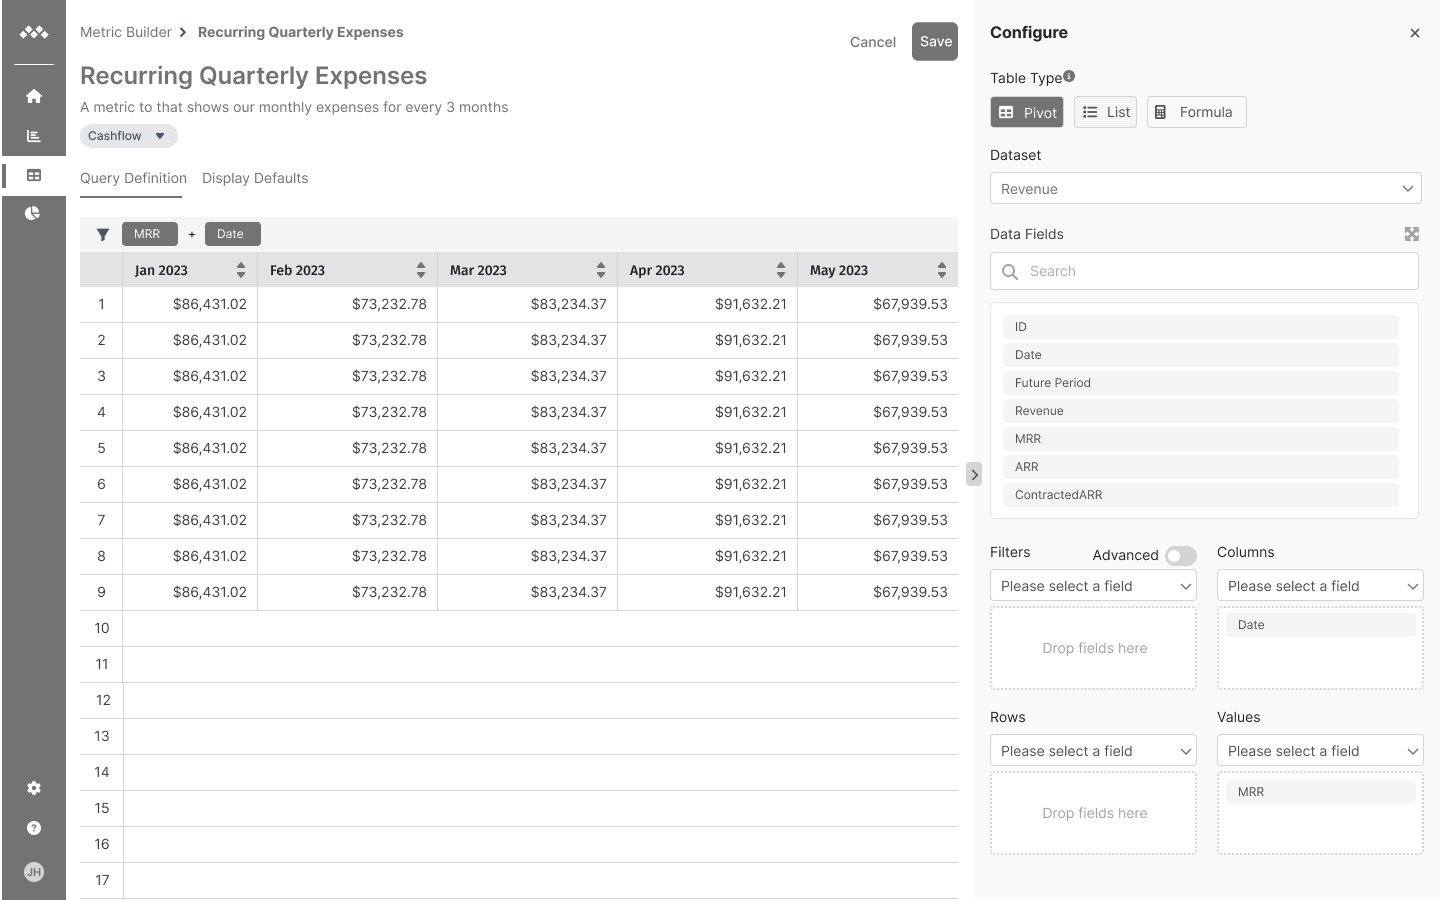
Interviewees wanted to build visually, so the table itself is the editor. Columns make the headers, Rows the labels down the left, Values the cells, and Filters narrow the whole table.
Animated mini of the builder. Date dropped into Columns becomes the month headers, from Jan 2023. Amount dropped into Values fills the cells. MStatus dropped into Rows adds Lost, Open and Won labels down the left. Moving MStatus to Filters folds the rows back into one and adds a filter strip above the table. Picking Open narrows the values to open opportunities.
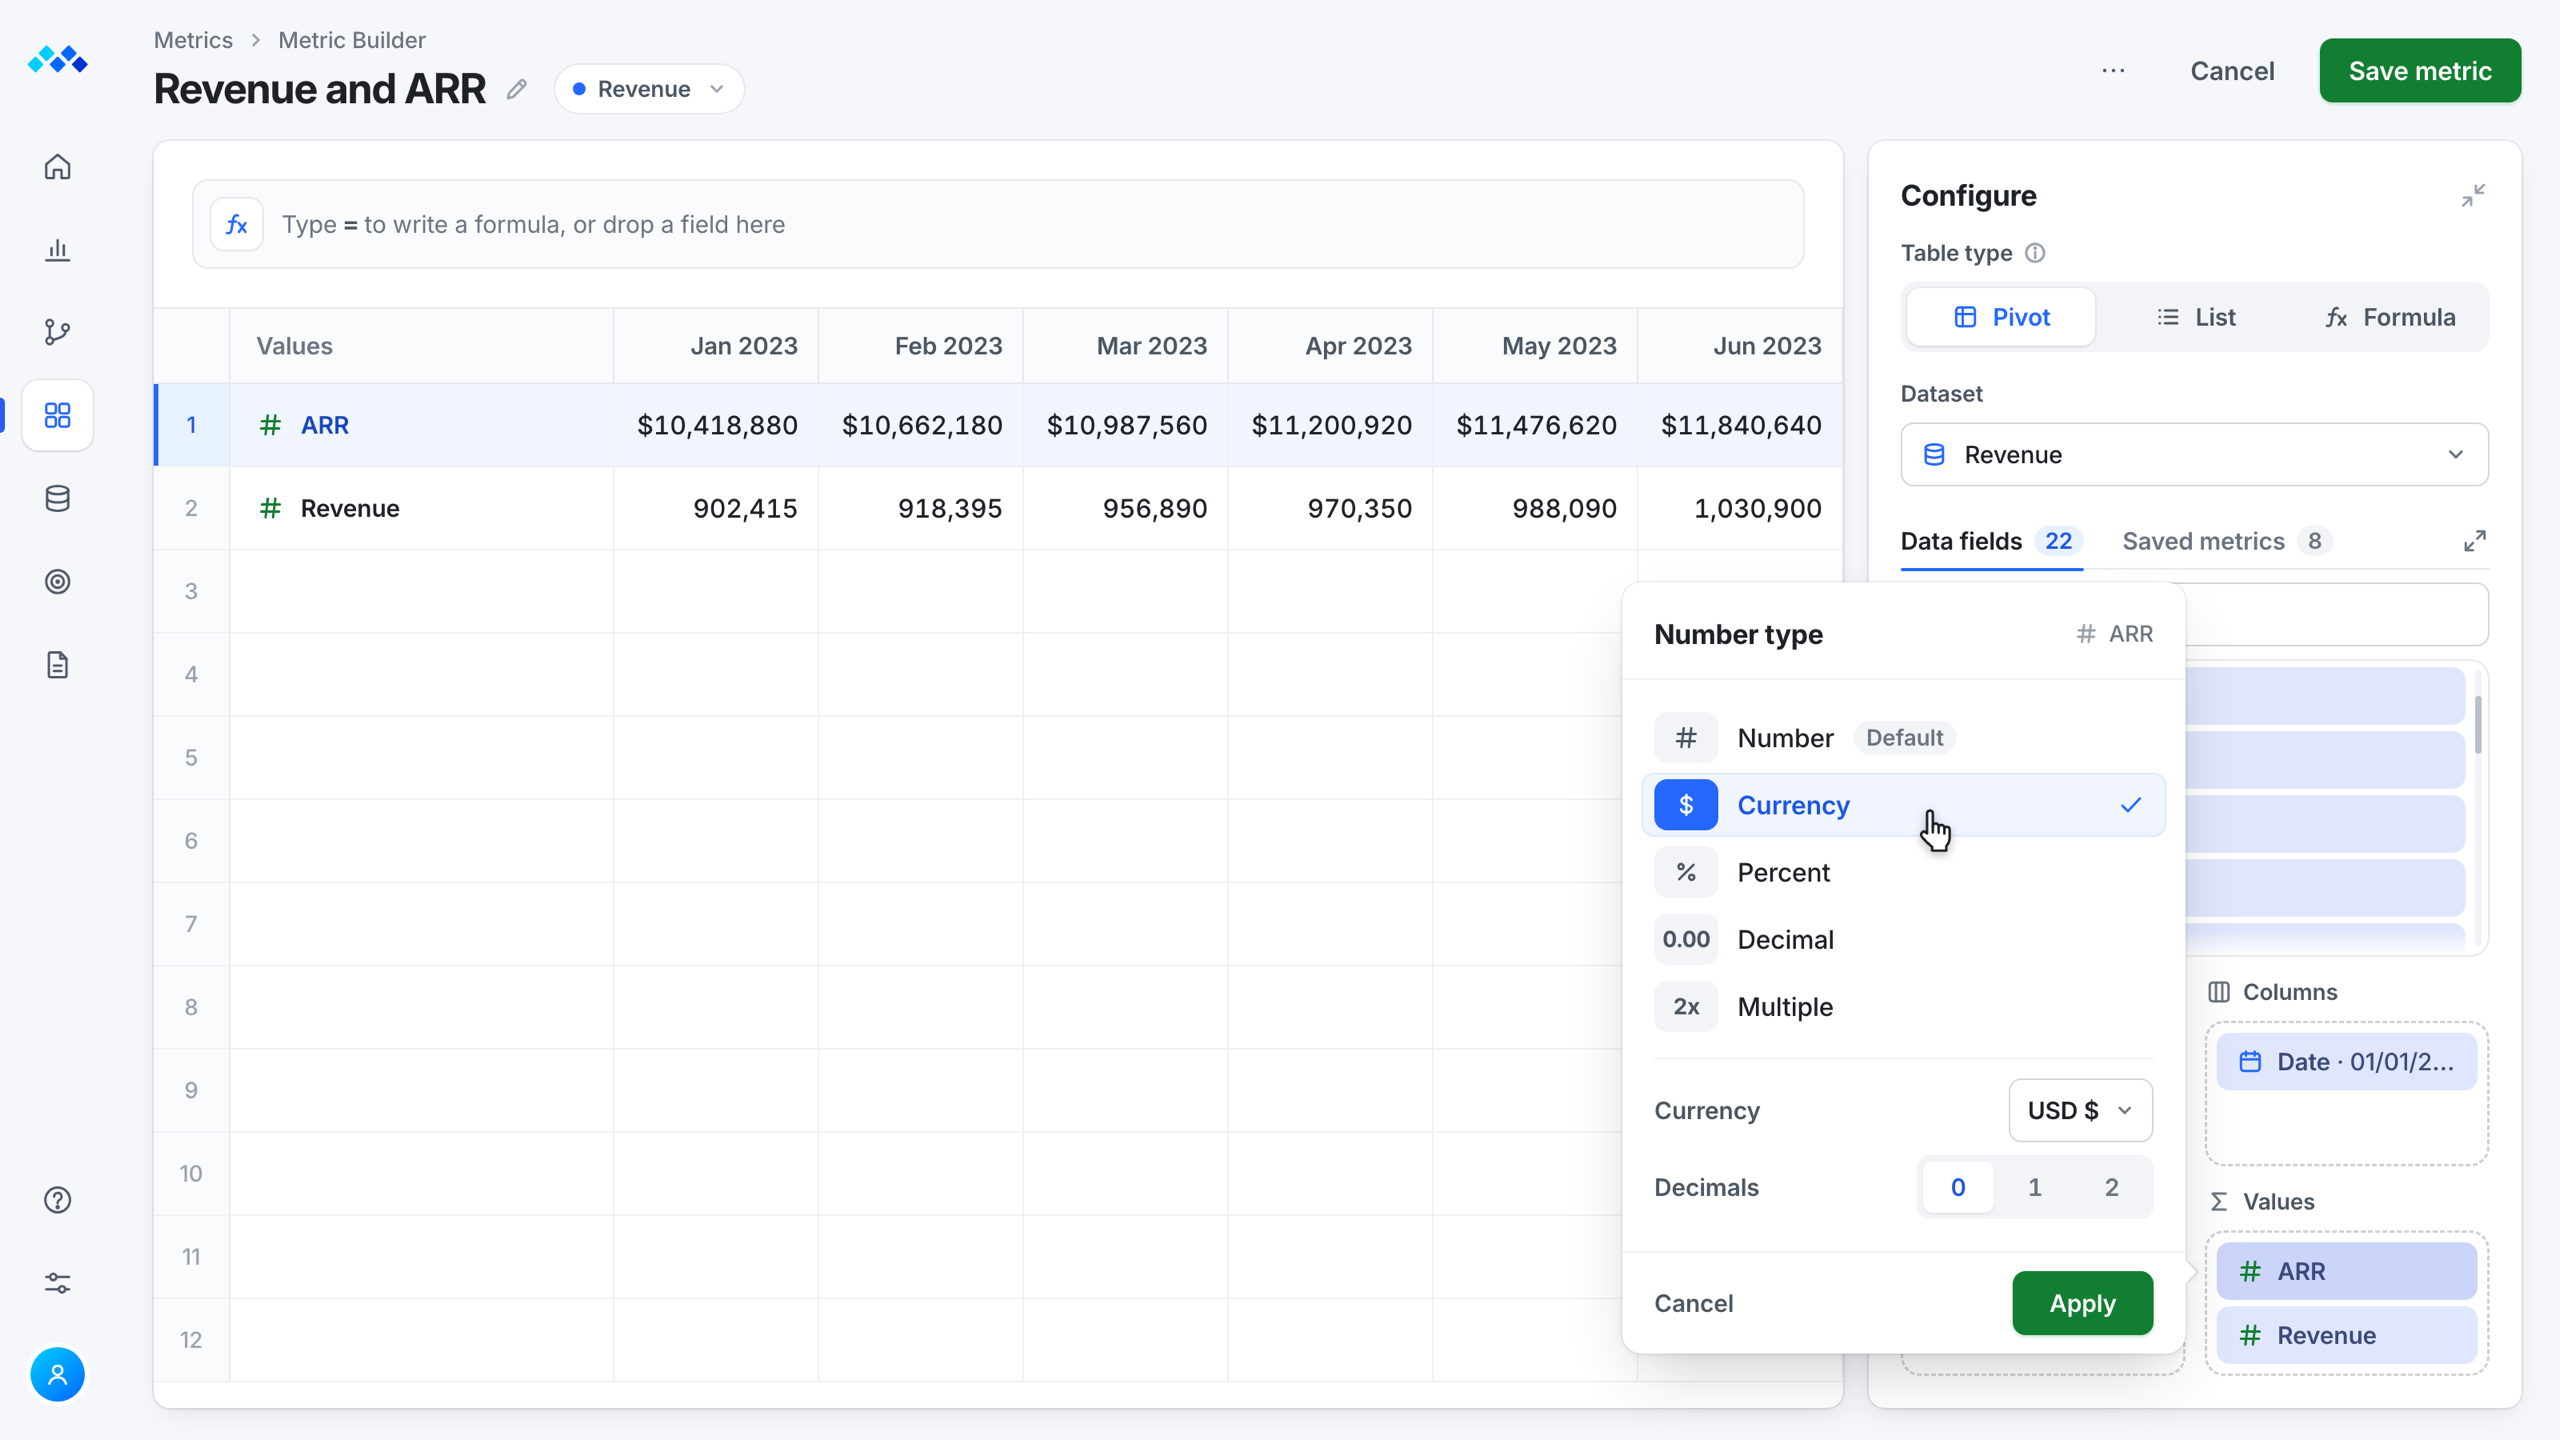
Inline editing came from the experienced analyst, and it keeps you in the table. Number type starts as Number and switches to Currency, Percent and others.
Shaped byThe Experienced Analyst
Animated mini of the builder. Clicking the ARR field in the Values box opens its Number type settings right beside it. Number is the default, and picking Currency turns the ARR row into dollars, $10,418,880 for January 2023, while Revenue stays a plain number.
It comes in as a token, and the original never changes.
Animated mini of the builder. A search of saved metrics for "recur" finds Recurring Quarterly Expenses, and Insert pulls it into a new formula as a token, ROUND of Recurring Quarterly Expenses divided by Revenue, to 3 digits, which fills the row with 0.096, 0.080 and 0.087 for January to March 2023. The saved metric reads "In formula" and "The original never changes."
When you save a metric, it goes to the top of the Metric Catalog, ready to use in the next one.
AnswersAccess differed across areas
Animated mini of the builder. Clicking Save metric on Revenue and ARR shows Metric saved, and the Metrics breadcrumb opens the Metric Catalog, where the new Custom metric sits on top of the saved metrics list, ready to be reused. The count goes from 8 to 9.
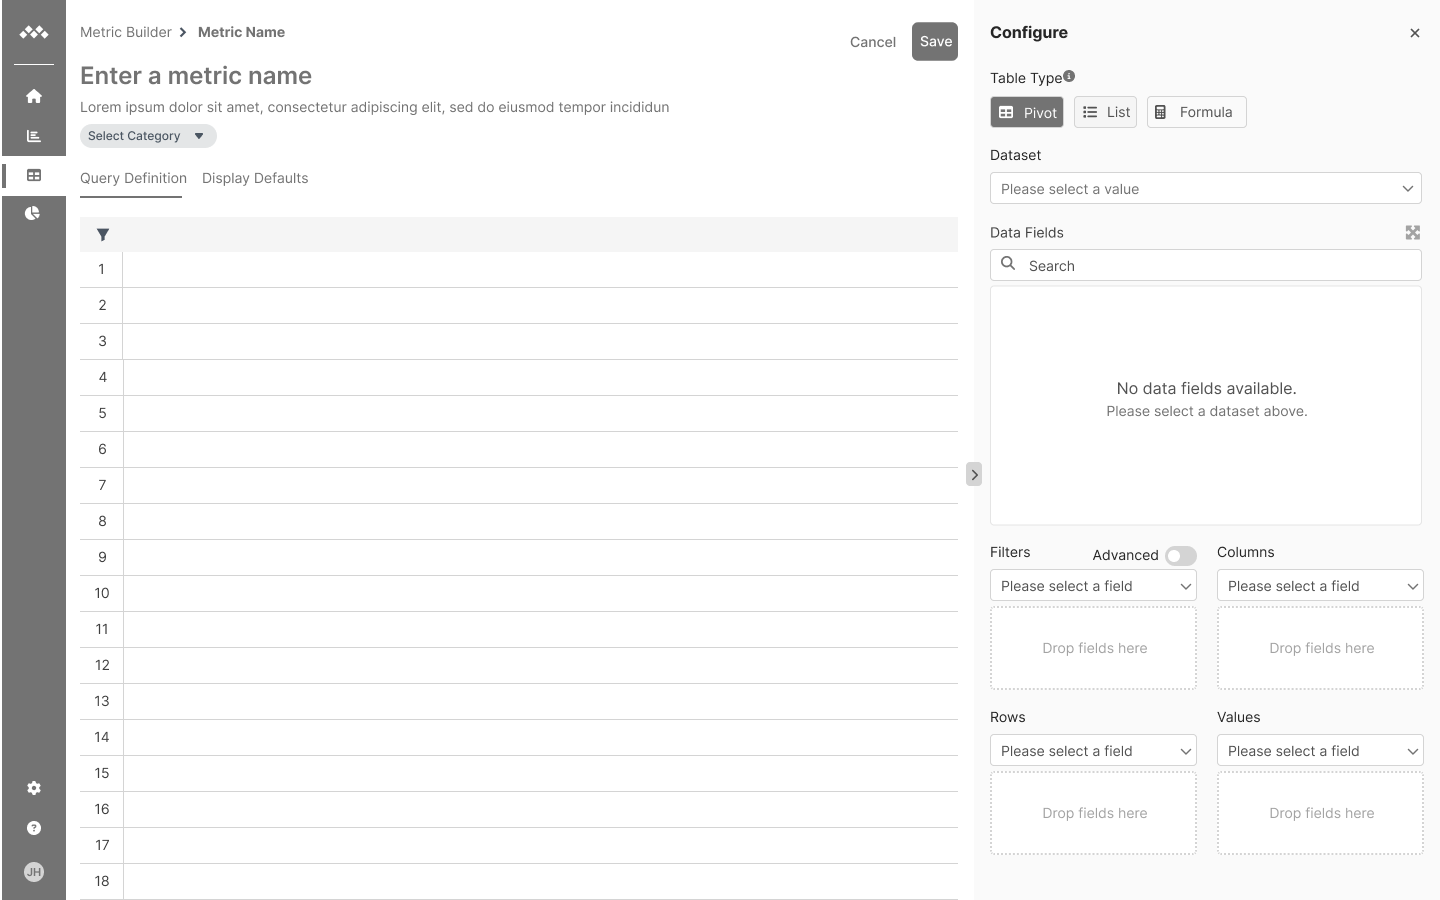
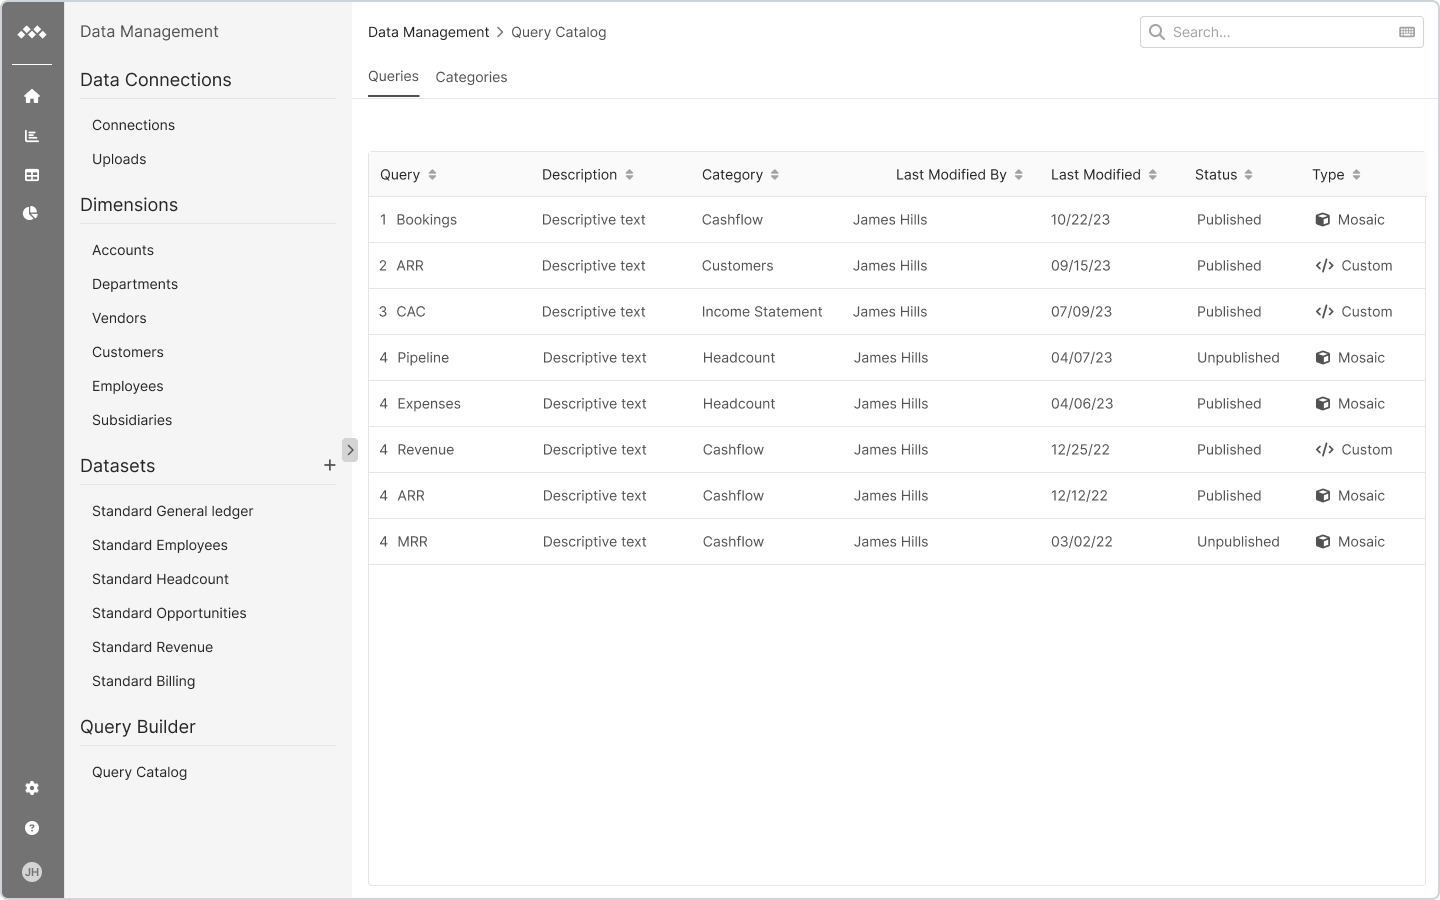
I explored layouts with our growing library of wireframe components, so quick user tests could check the flows and structure before any detailed UI work.
Testing
I tested in rounds with 5 to 7 people, then in production.
Product tour
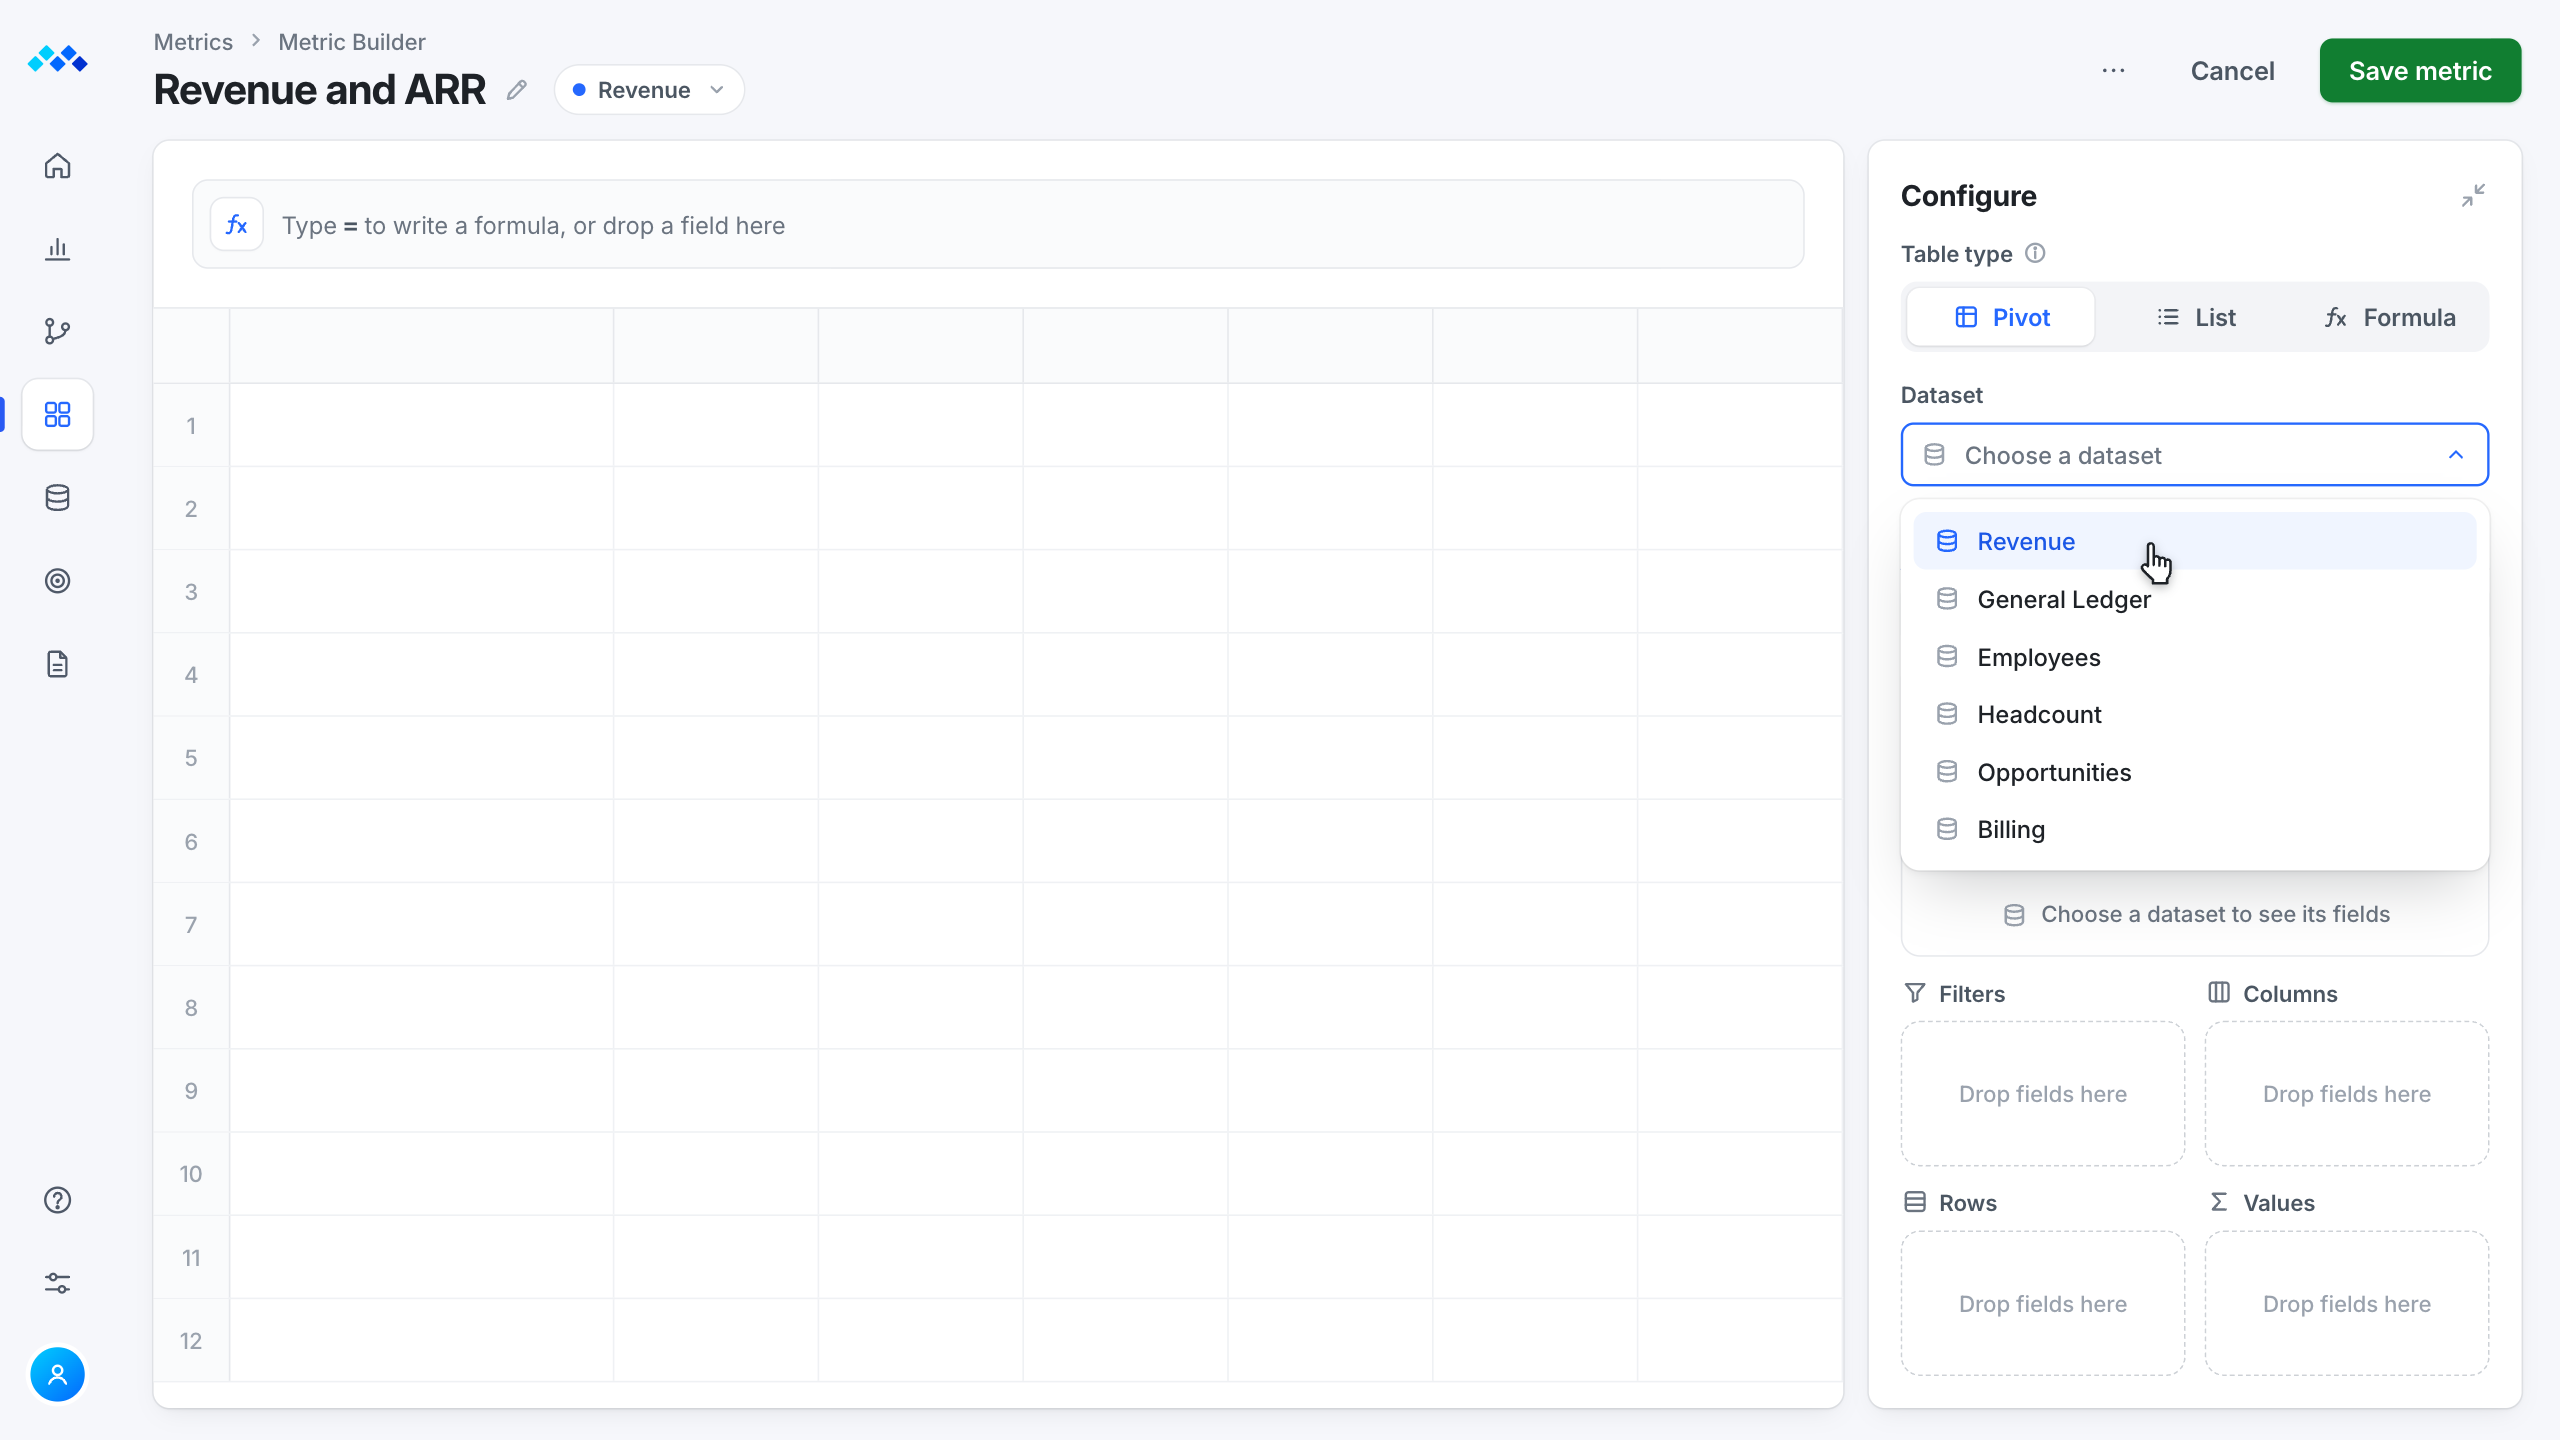
Step 4 is the other way in, a formula instead of drag and drop.
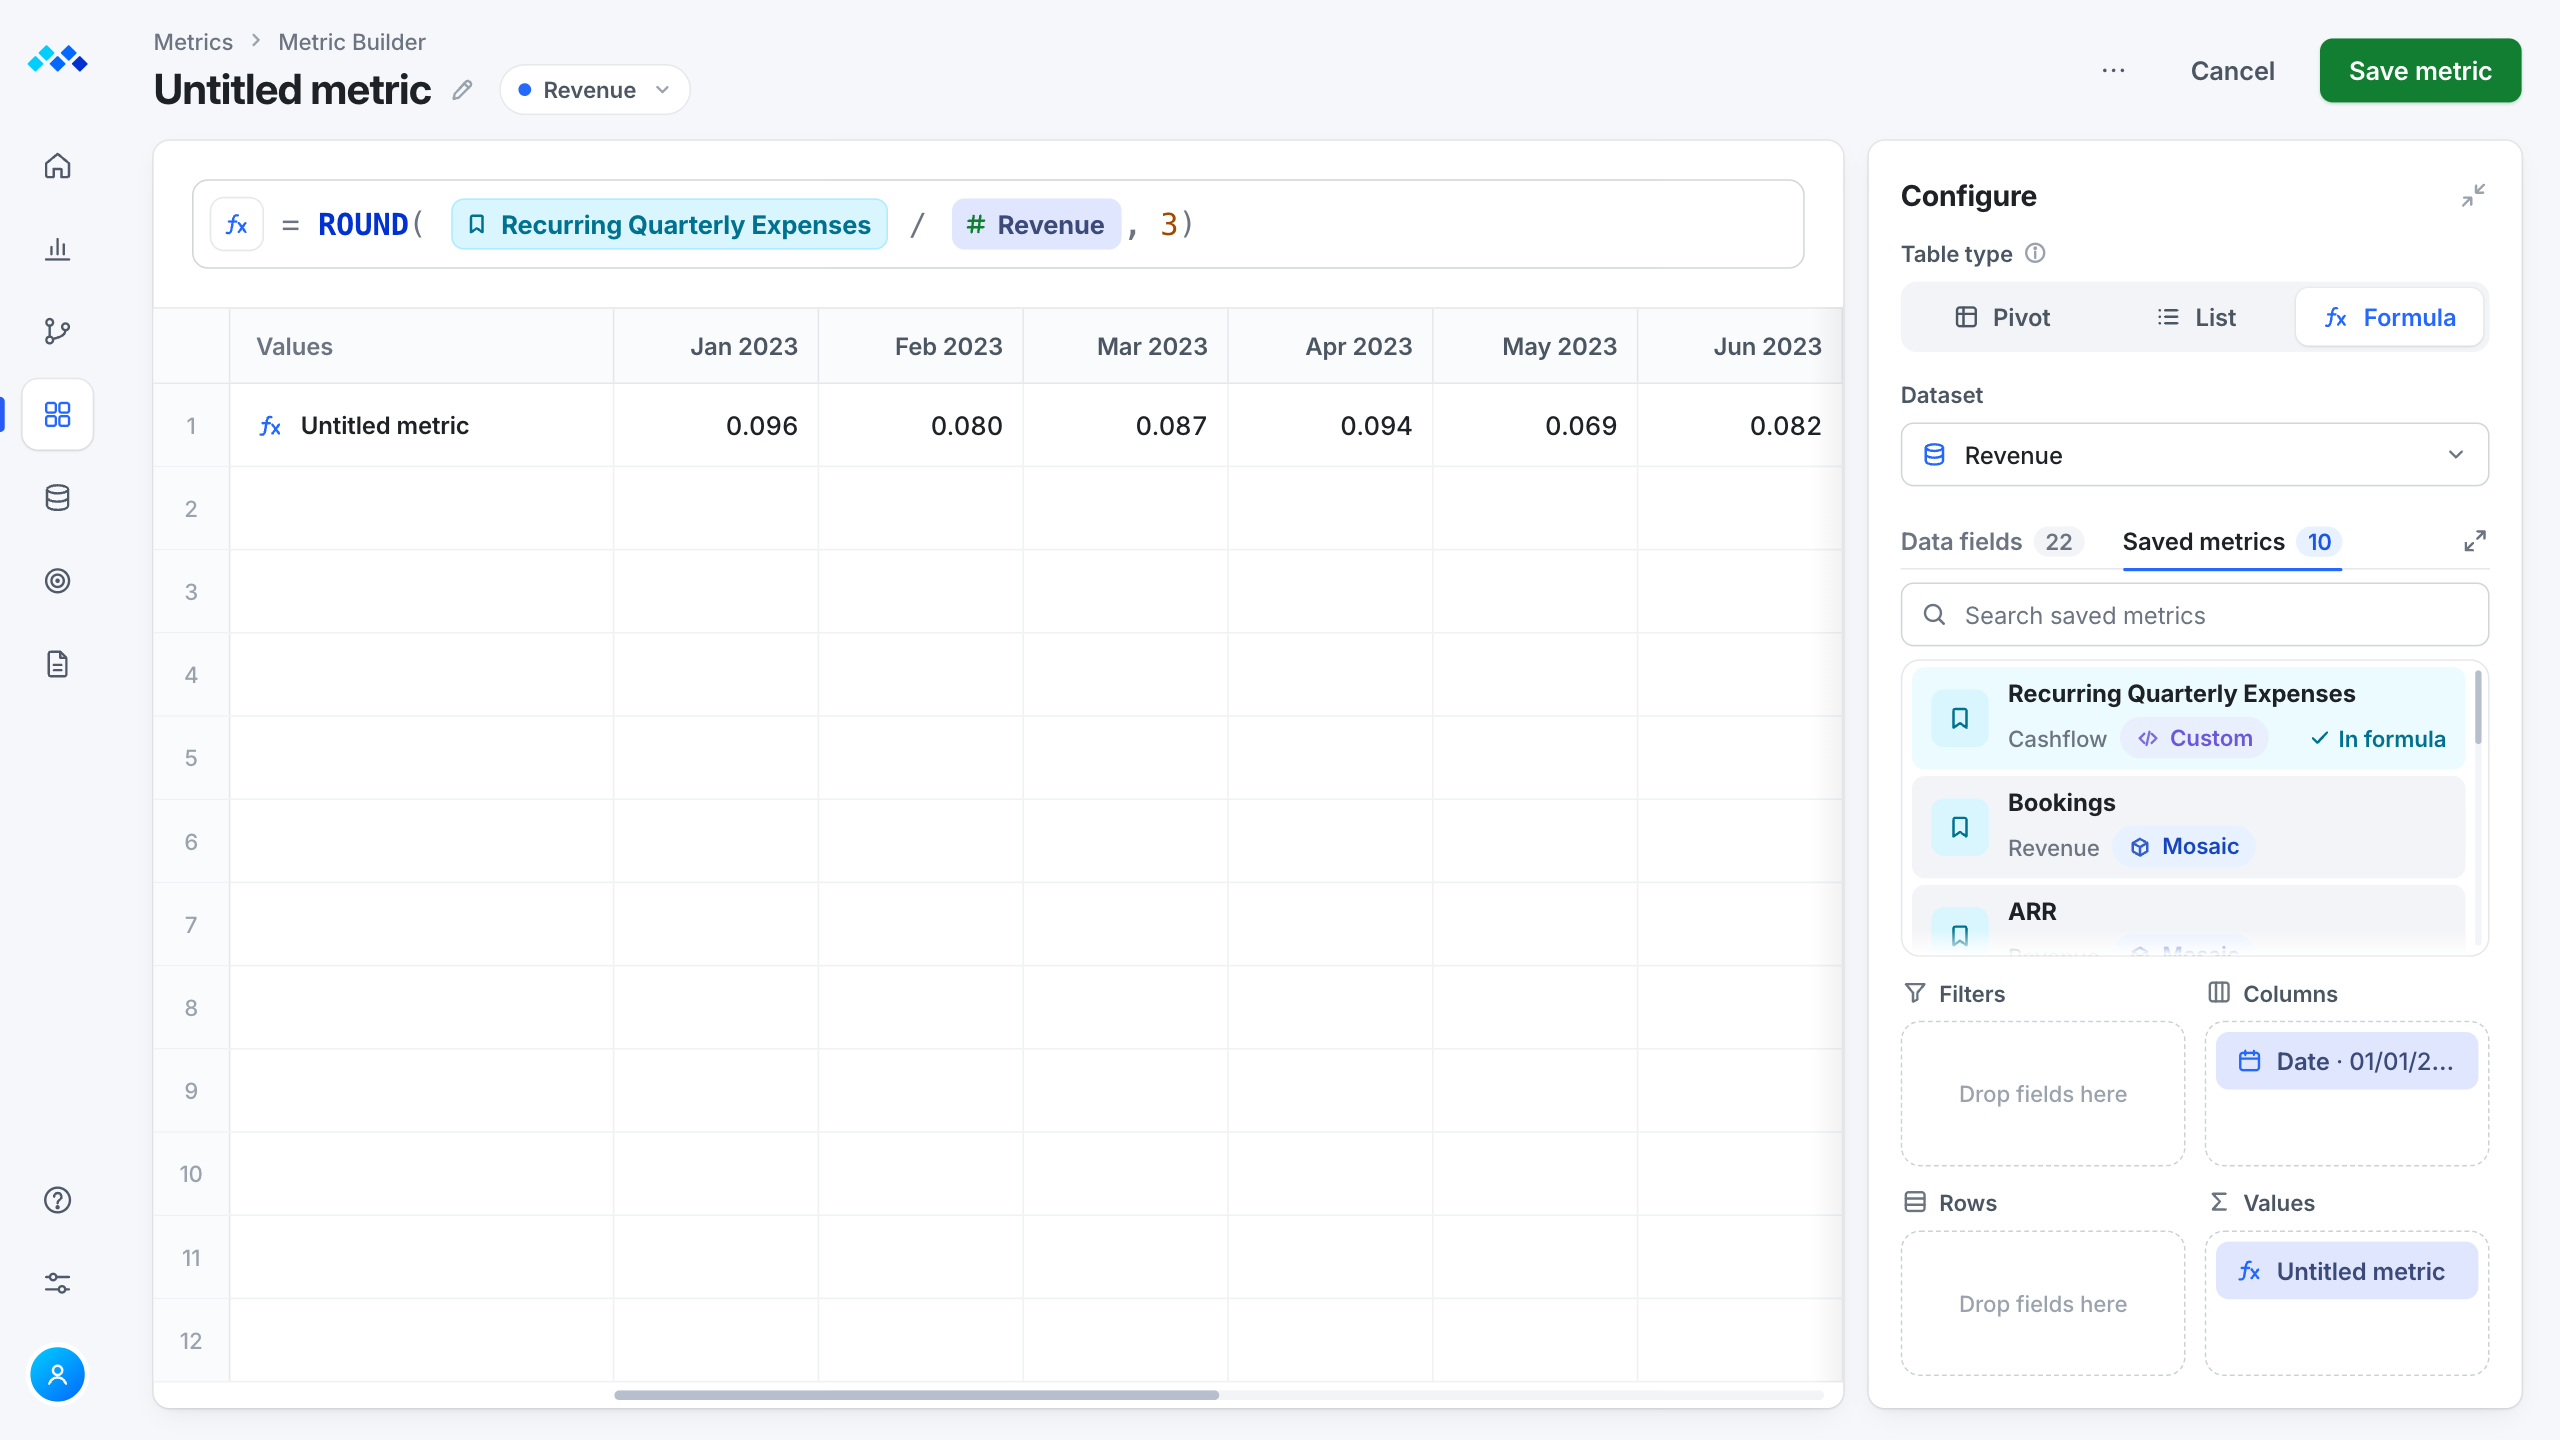
Try it
Every drop updates the table, so you see the metric before you save it.
Interactive Metric Builder. Move the fields Date, Revenue, ARR, Amount and MStatus onto the table or into the Filters, Columns, Rows and Values boxes, and the table builds as you go: Date in Columns makes the month headers, numbers in Values fill the cells, MStatus in Rows adds one row per status, and fields in Filters narrow the table. Click a field to pick a box, click a chip to change its settings, click the title to rename the metric, save it with Save metric, and use Reset to start over.
Configure
Data fields 5
Filters
Columns
Rows
Values
Results
Feature usage rose 35% within three months of release, and metric helpdesk tickets fell 45%.
A visual, table-based UI with drag and drop and inline edits, to cut creation time at every skill level.
Result
Under 5min per metric
Users said their tasks got simpler.
Non-destructive nesting of pre-built or custom metrics, so advanced users can build on a metric without touching the original.
Result
80%of beta testersnoted easier nesting and edits
Users got more control and faster turnaround when creating or editing custom metrics, relied less on the support team, and non-technical users could do more on their own.
Bring metrics into every area of the platform, to cut silos, help teams work together and speed up workflows.
Result
35%more feature usage
Easier integration and shorter onboarding for new clients helped usage grow.
45%fewer metrichelpdesk tickets
Self-service let users at every skill level do more on their own.
We ran FigJam brainstorms and got steady input from SMEs and eager Mosaic clients, which sharpened our process and made the UI clearer for very different users.
Metric Builder grew from an advanced feature into a tool for everyone, and planning on casual feedback wasn't enough. Next time I would add formal user research early to predict those changes and keep the work focused.
Metric Builder · Mosaic
I kept the formula for experts and gave everyone else drag and drop.