Make setup quick
Result
About35%less report setup time
Finance teams build reports faster.


Mosaic · FP&A reporting case study
Redesigning how finance teams build and edit reports in Mosaic
In Mosaic's Custom Reports, every edit went through a side panel, and the report didn't change until you pressed Update. I led design and research to move editing into the report itself, and report setup time dropped by about 35%.
The problem
Delta is Actuals minus Budget. Here is the same task done both ways.
Before8 steps
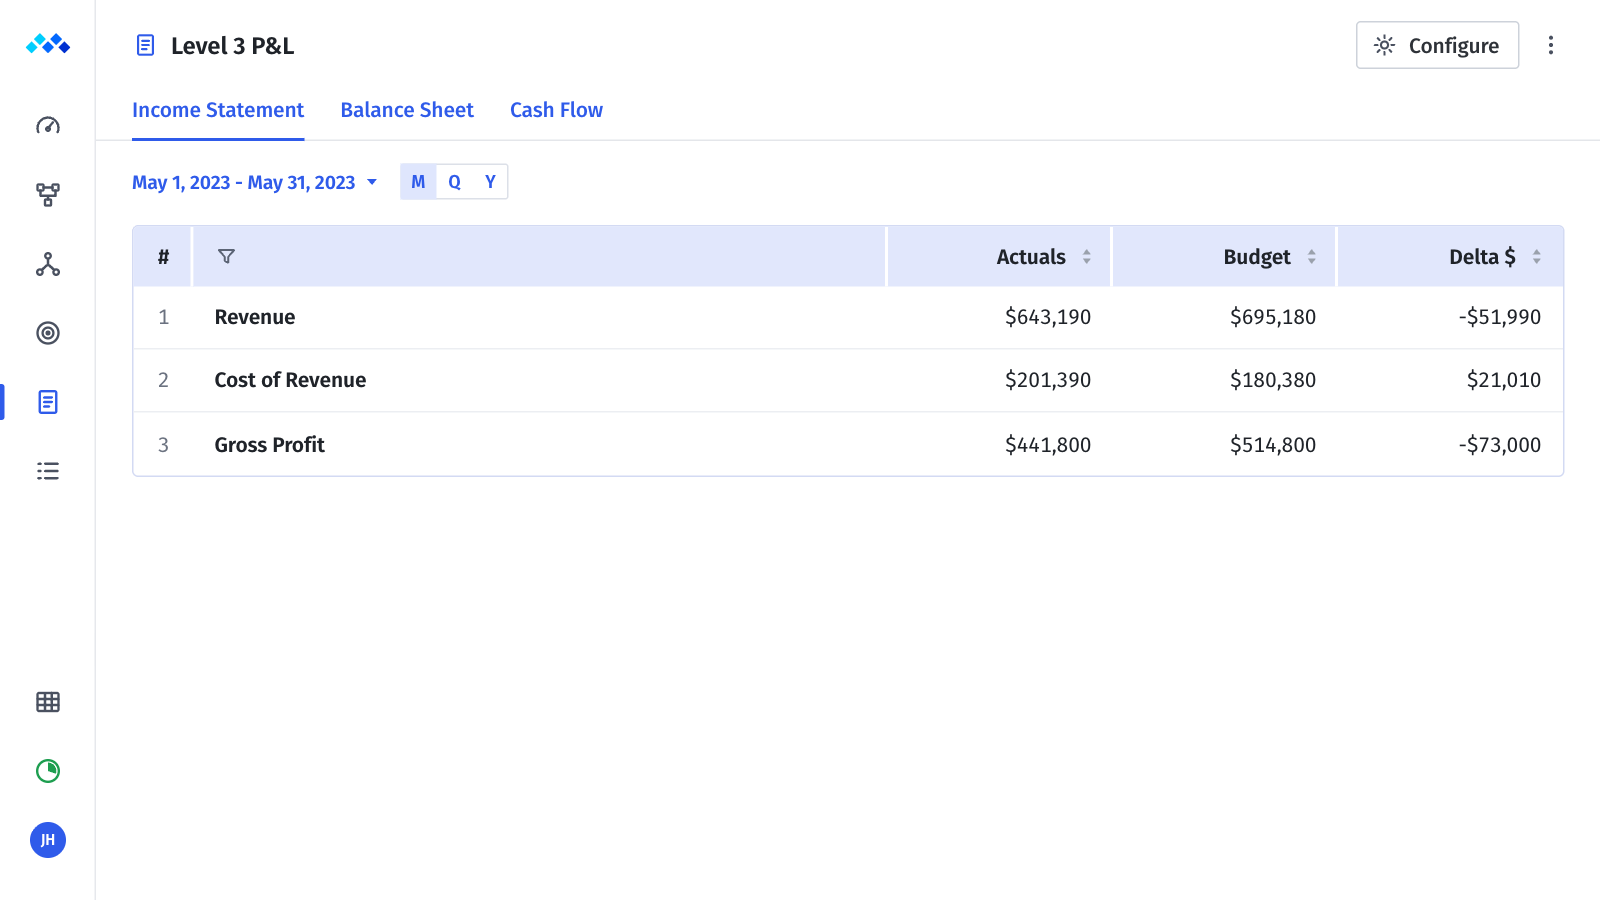
Every change lived in a side panel. Pick a section, change a setting, press Update, wait.
After6 steps
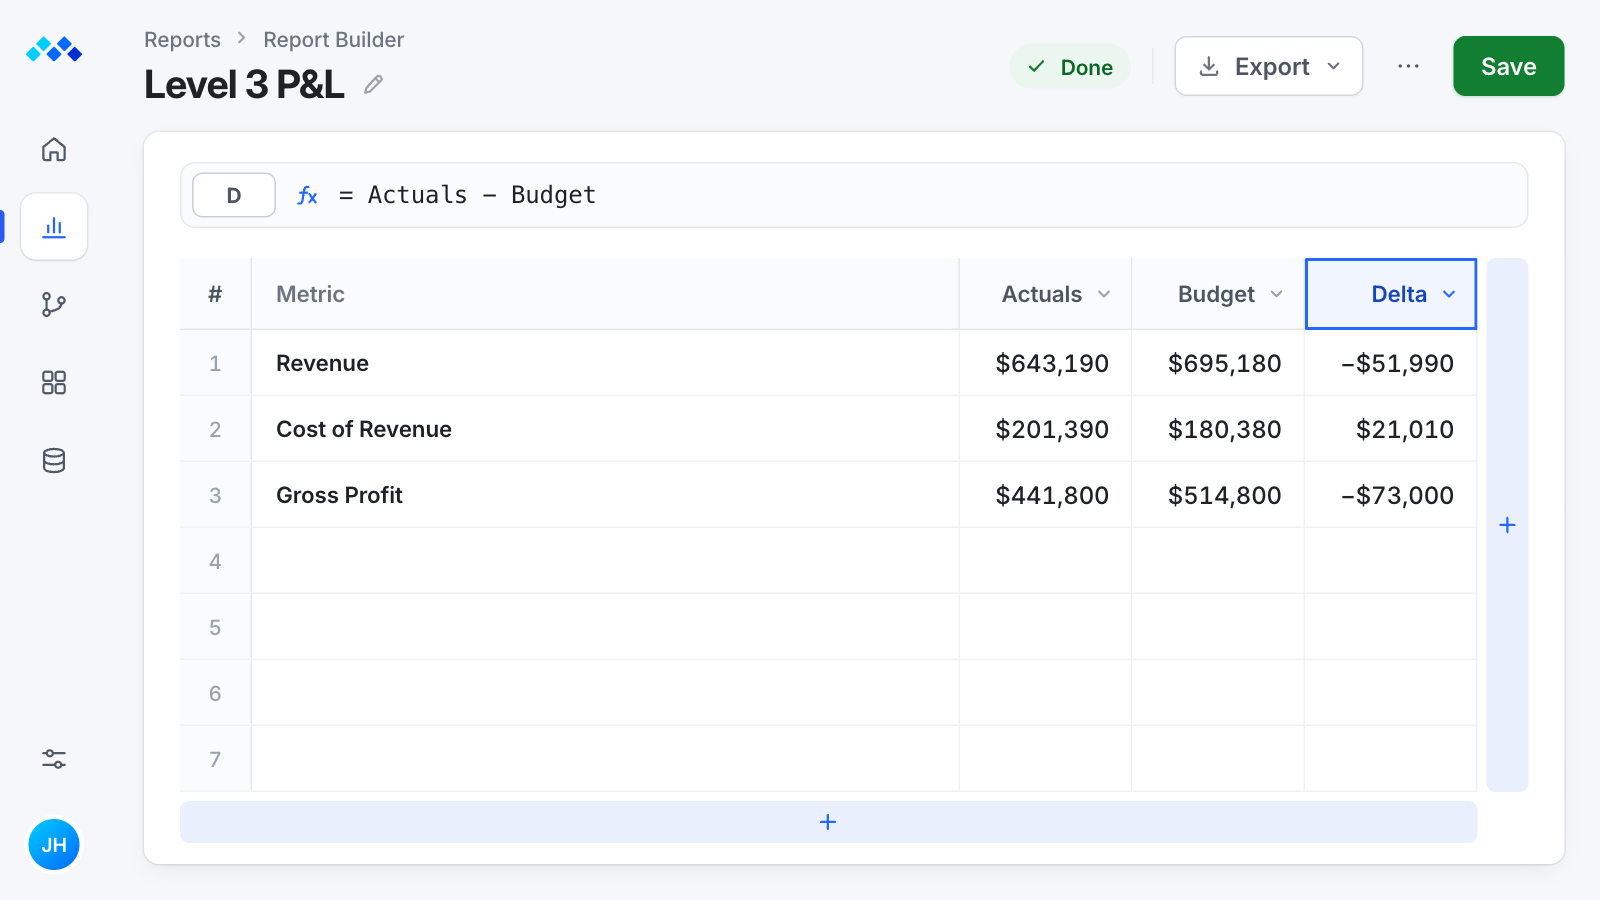
Change it in the report.
Changes made in the menu were slow to show up in the report, which made quick, live tweaks frustrating.
Every change waited for Update
Bringing large volumes of data together took time, which hurt precision in dynamic reports.
The report structure was fixed, so teams couldn't shape a layout around how their company reports.
Noted in a third of feedback
Feedback kept coming back to editing outside the report, so we wanted editing inline and fewer manual fixes.
Quick setup should cover anything from a basic cost summary to an advanced logic-based model.
PDF and CSV exports should be easy, so reports reach the whole team.
Formulas and pre-set metrics like ROI should work on the spot for quick math, and large data should be handled fast.
My role: Design lead at Mosaic. I led design and research for Custom Reports, turning a rigid reporting tool into a flexible one with inline edits, in-report metrics and formulas, and visual styling. I owned competitor analysis, user studies, personas, wireframes and high-fidelity designs, working closely with PMs, subject matter experts (SMEs) and engineers.
The 30-second read
Adding Budget and Delta now takes 6 steps instead of 8, with no wait.
You edit the report where you read it, then export it to PDF or CSV.
User engagement rose 25%, and exports got better styling and selective sharing.
Walkthrough · 57 seconds
I build one P&L report and export it as a PDF.
Research
Discussions and feedback showed gaps in scalability and in the interface. Planners built basic reports, and modelers ran complex projections.
Design influence: Pointed to quick, visual inline edits, so everyday reporting tasks stay fast.
Design influence: Guided inline styling and more versatile exports, and needed formulas and metrics built into the report.
Way inPick a metric
Way in= Formula
In early discovery I looked at Excel, Google Sheets, QuickBooks and Tableau, the leading tools for strategic financial reporting. They left room for inline customization and data syncing, which Custom Reports set out to fill.

 Spreadsheets
They led basic reporting in SMBs because people knew them, but users cited poor real-time integration.
 Accounting
It led SMB accounting with solid reporting, but inline edits were limited and users found it rigid.
 Visualization
It excelled at data visualization, but high costs, steep learning curves and long onboarding put off non-technical users.
Non-technical users preferred Excel and Sheets for the basics but wanted better inline tools for models.
The insight
The same sheet handles a basic cost summary and an advanced logic-based model.
Two paths into one report. The new planner picks metrics and edits the report inline, and the experienced modeler writes a formula in a column header, Delta equals Actuals minus Budget, and segments Revenue by Product. Both build the same report: a May 2023 group with Actuals, Budget and Delta, Revenue split into Subscriptions, Services and Total Revenue, then Cost of Revenue and Gross Profit.
The old flow
Only one step in the old loop was the edit itself.
Journey schematic. The old flow: open the report, open the Configure panel, change a setting, Confirm or Update, wait for the data to sync, check the table, then repeat from the Configure panel for every change. Friction points: the edit workflow at the Configure panel, data sync while waiting, and customization limits when checking the table. Alongside the map, examples of table layouts and interactions were gathered for ideas. The new path: click a cell, edit in place, see it now.
Design
We showed early wireframes to stakeholders and users, and their input shaped these four.
In early exploration we showed wireframe ideas to stakeholders and users, and their input on inline editing and export options shaped the high-fidelity mockups.
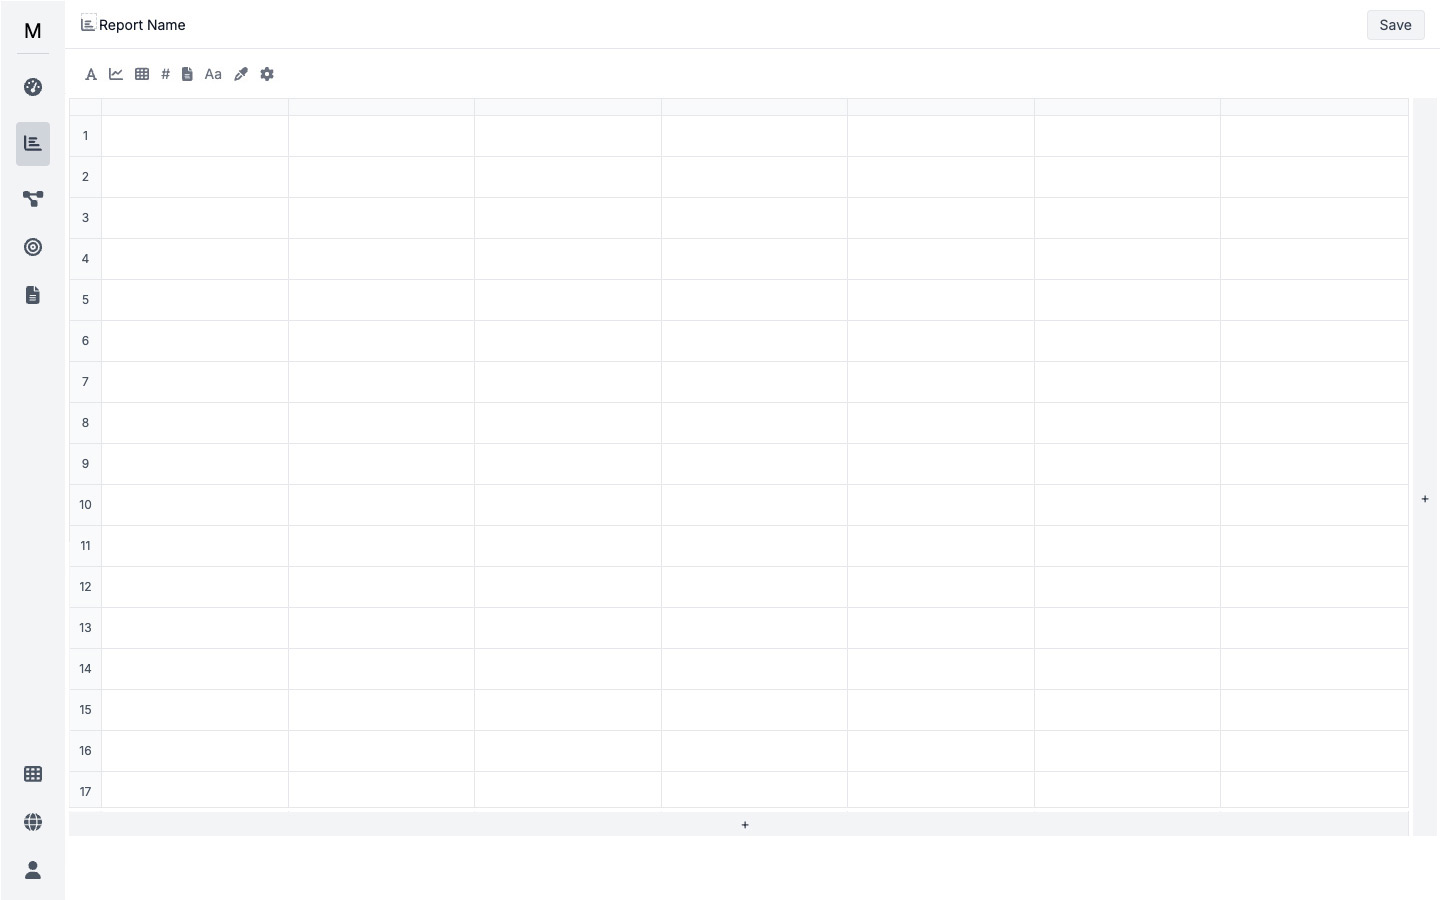
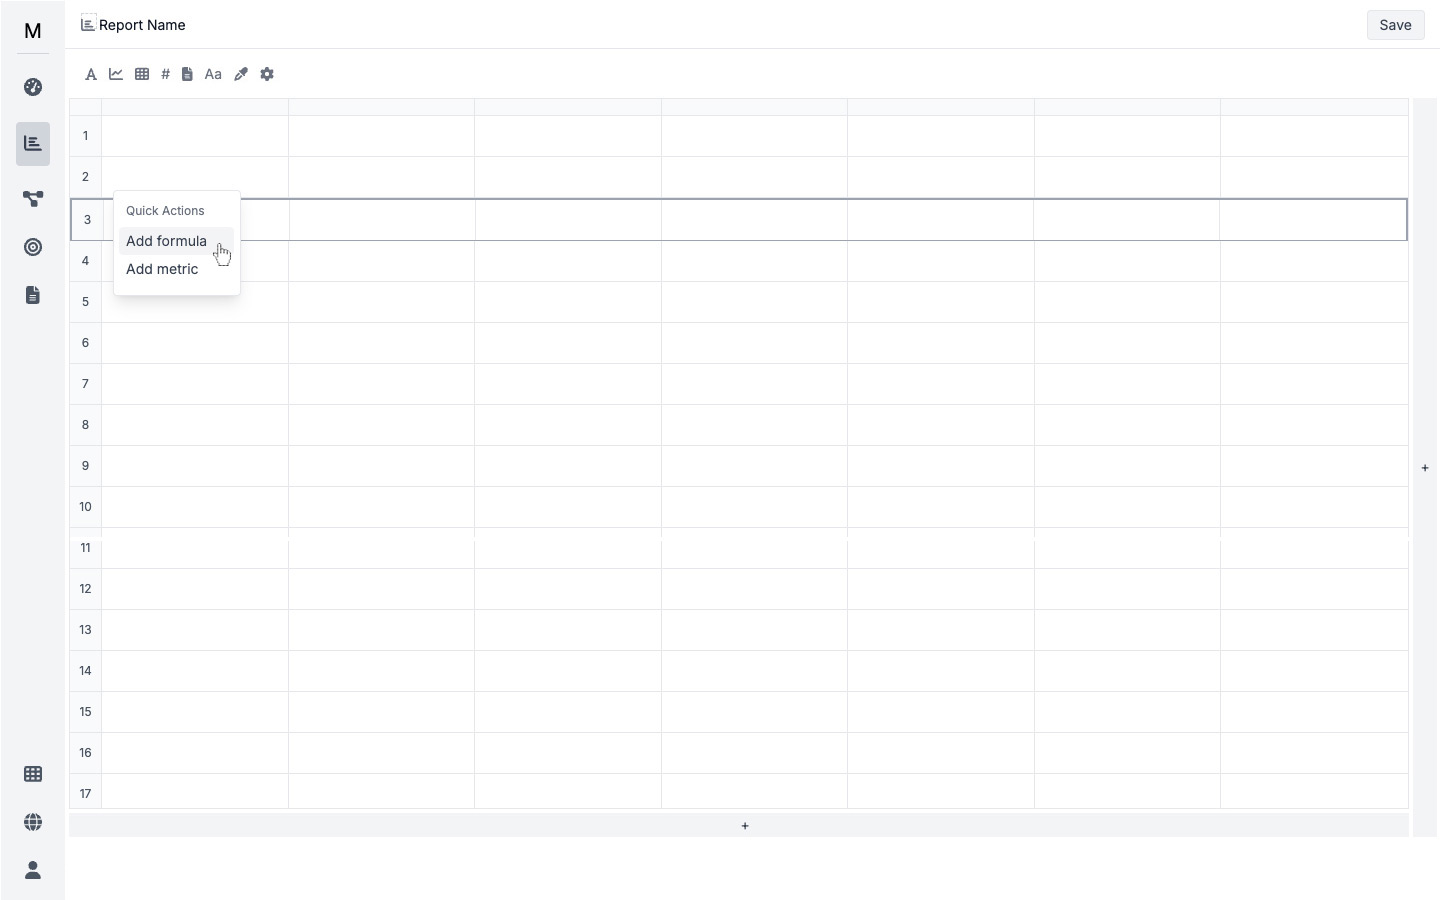
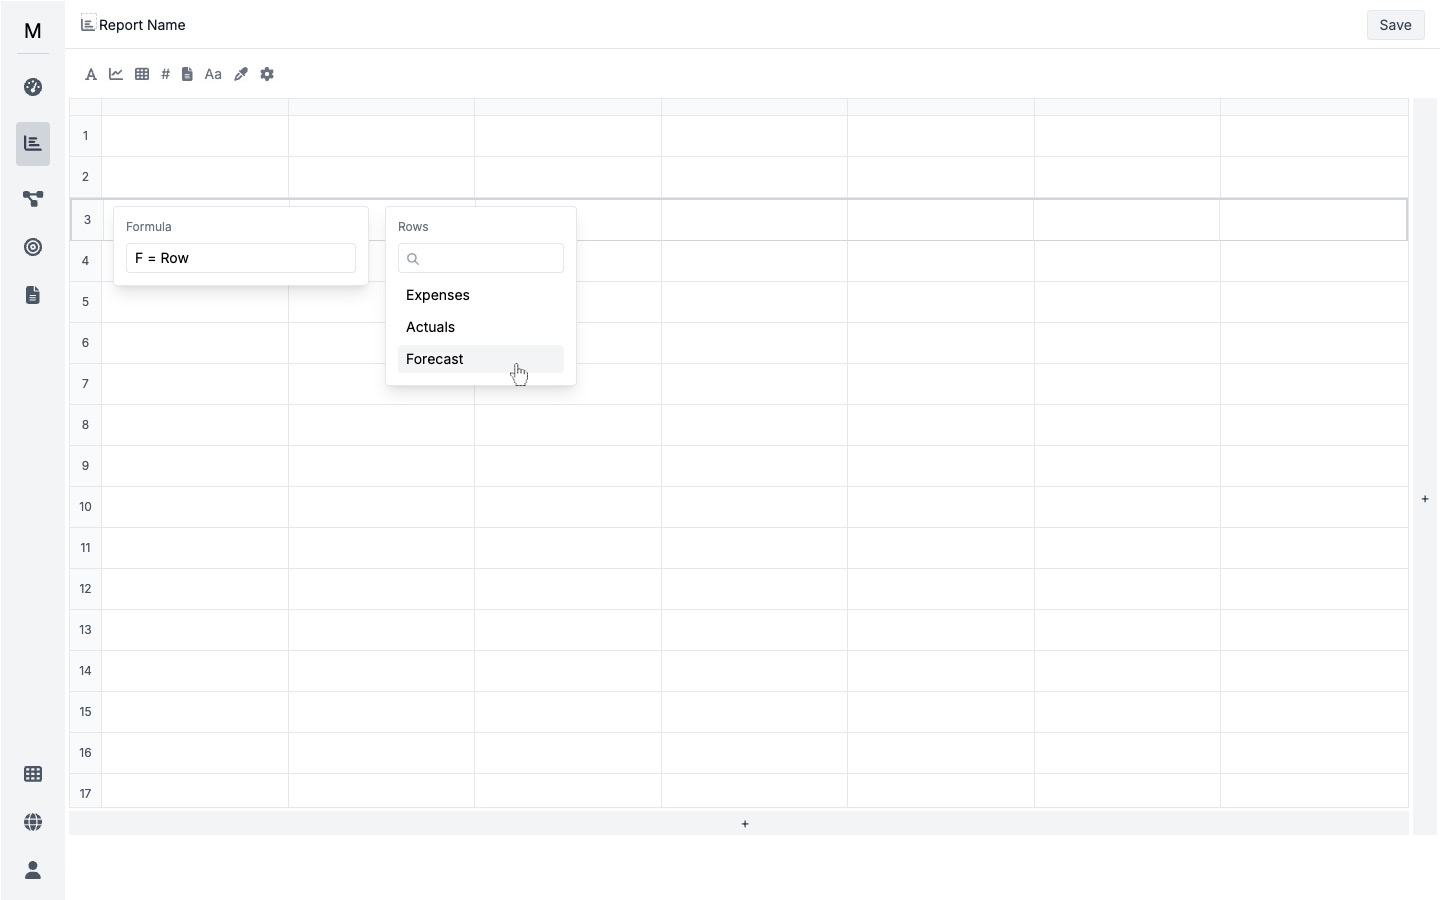
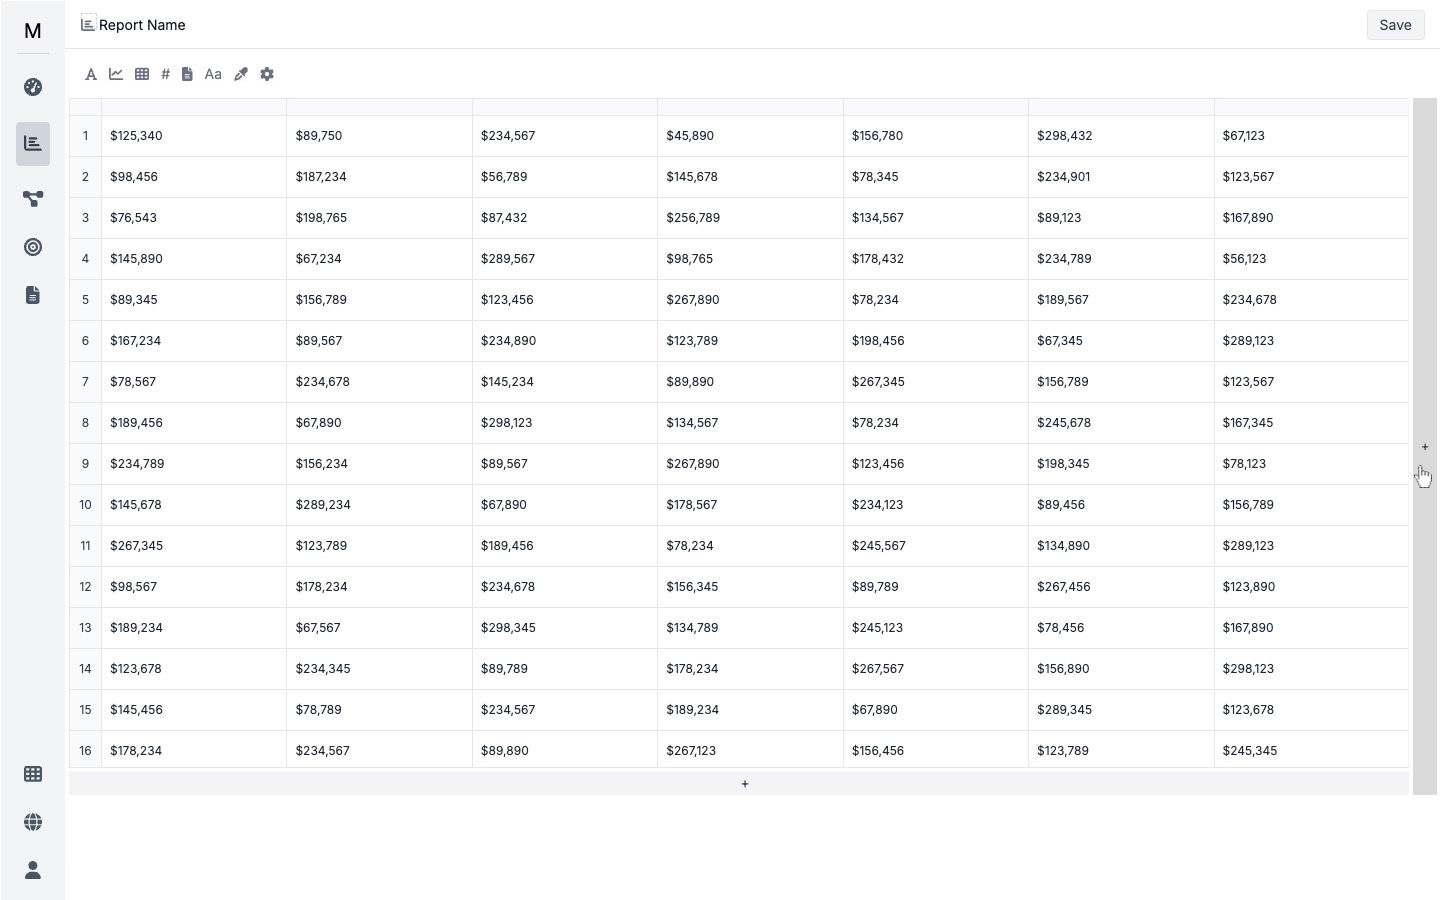
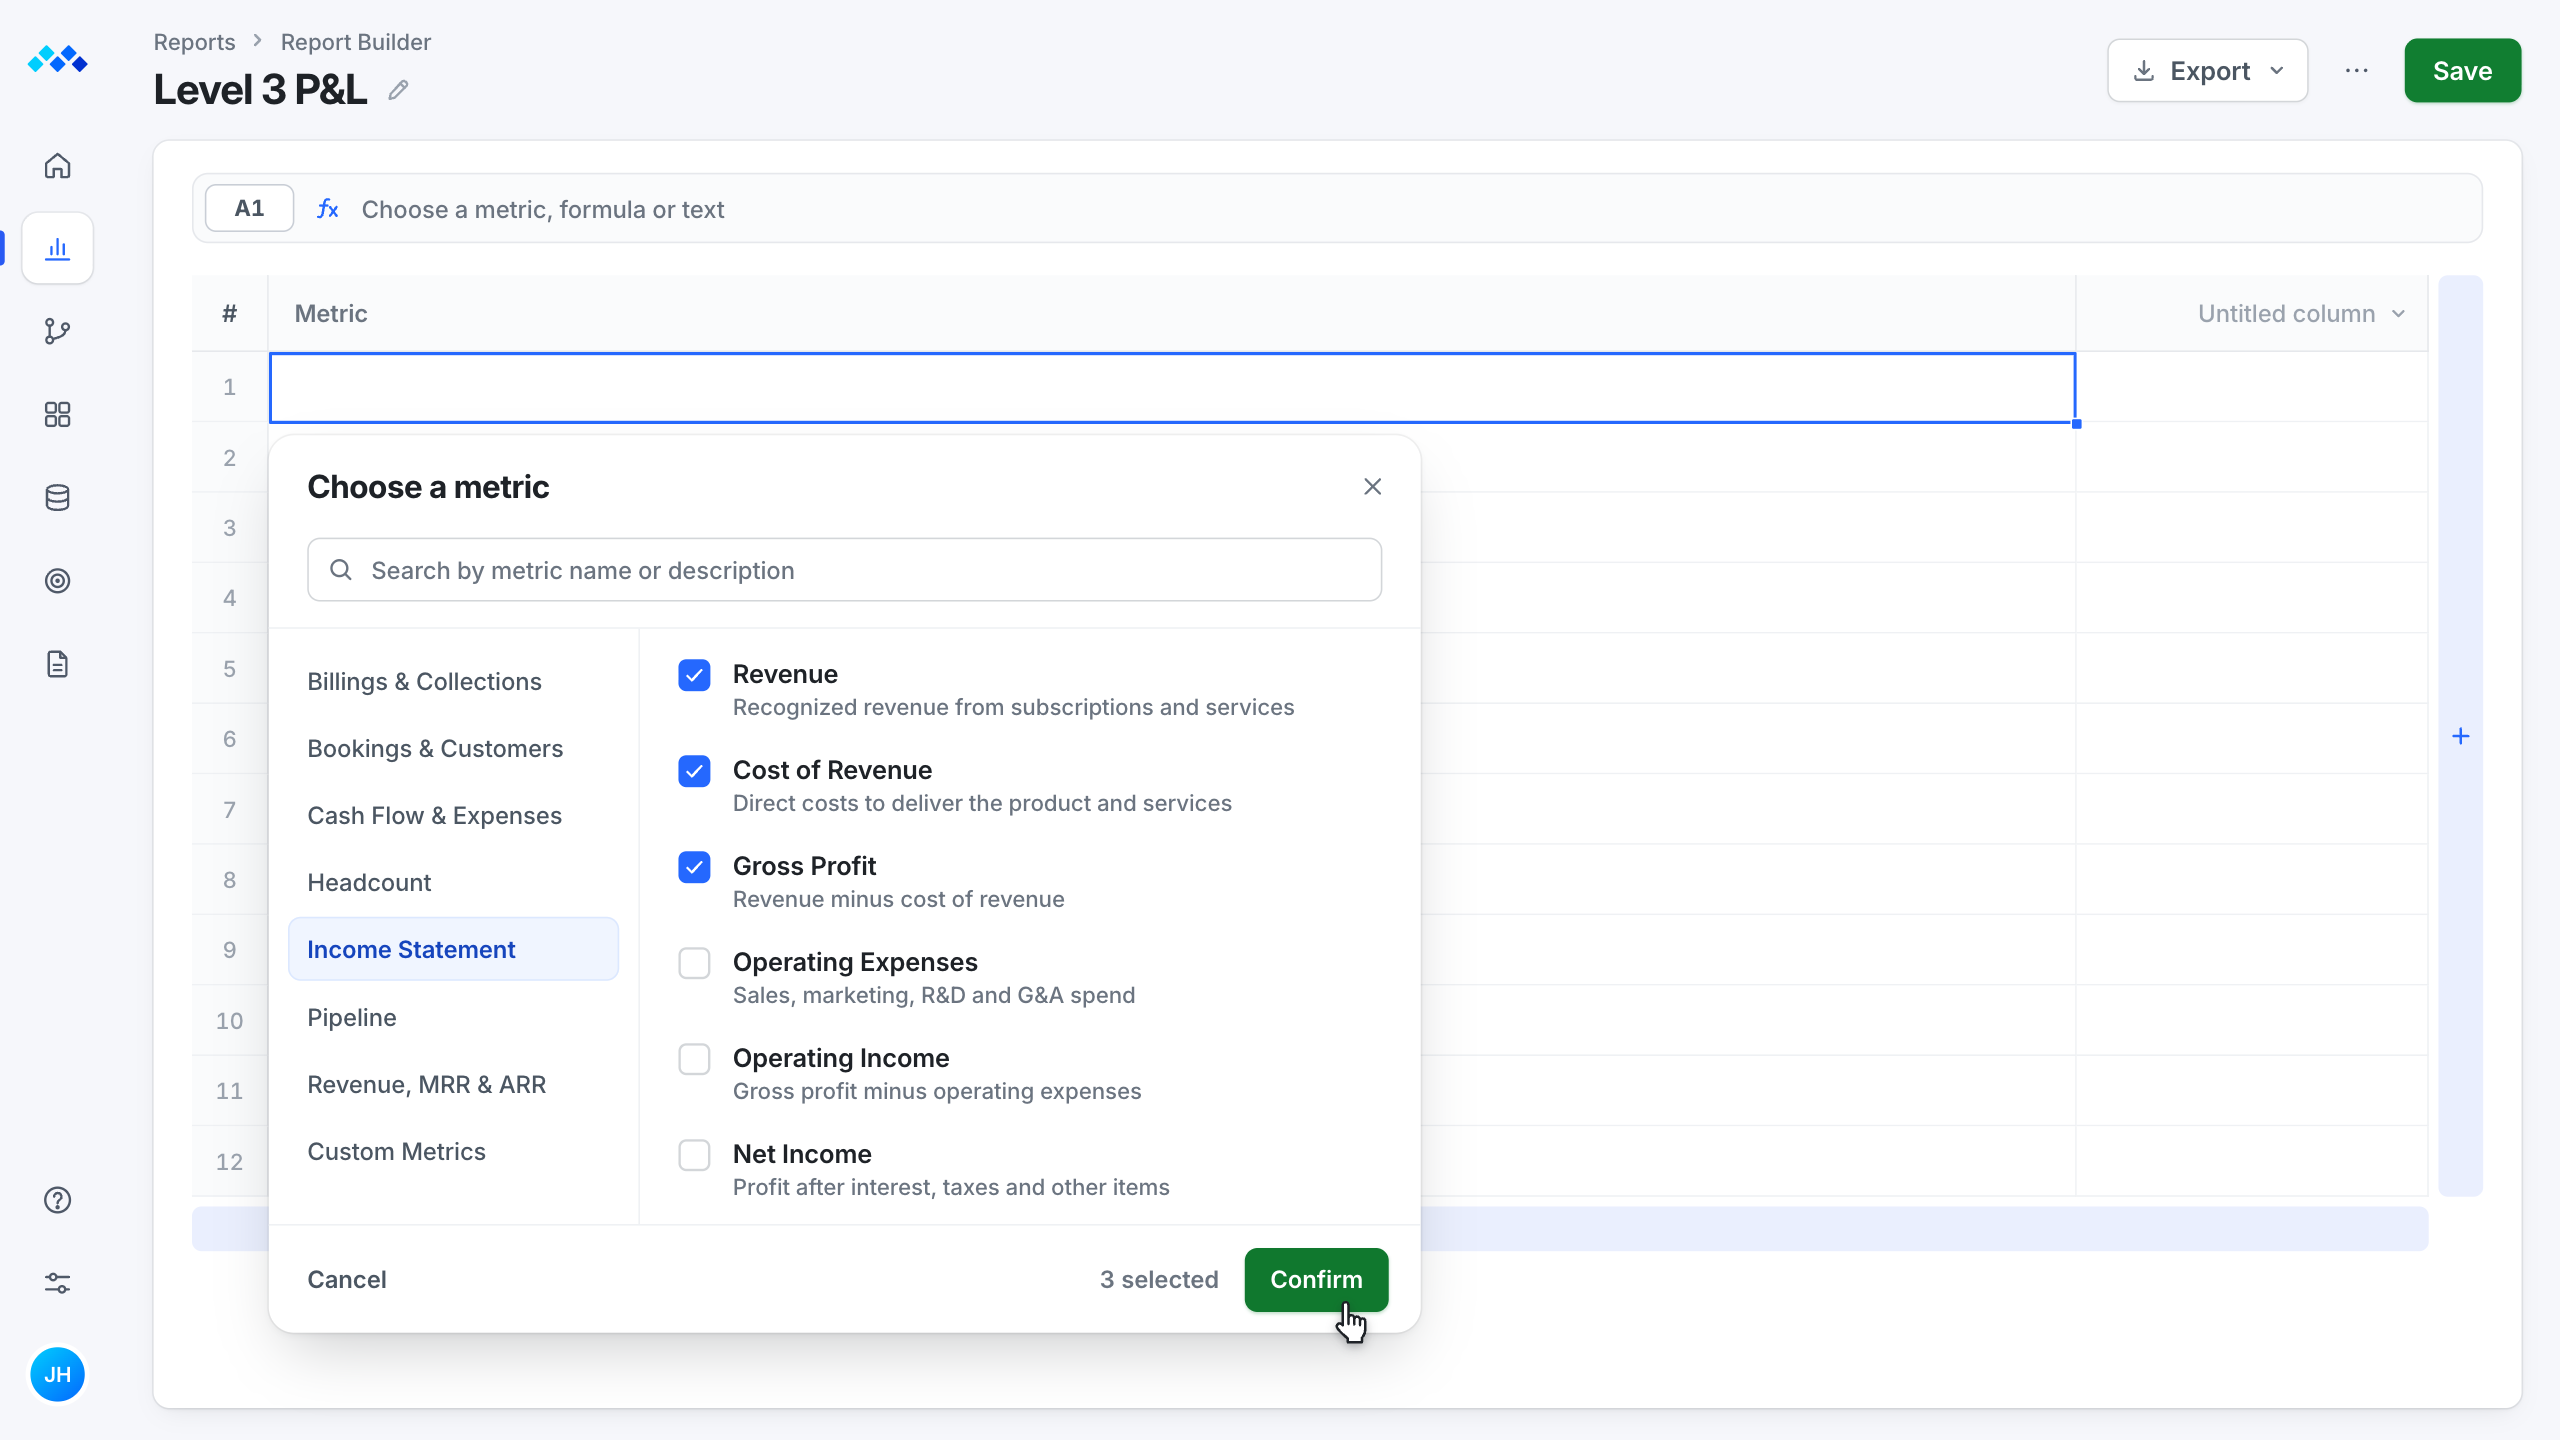
Click a row's first cell and choose Metric. Check what you need in Choose a metric, and each pick lands as a row with its data.
Animated mini of the report. Clicking the first cell of row 1 offers Metric, Formula or Text. Picking Metric opens Choose a metric on the Income Statement category. Revenue, Cost of Revenue and Gross Profit are checked, and after Confirm each one lands as a row with its Actuals and Budget values.
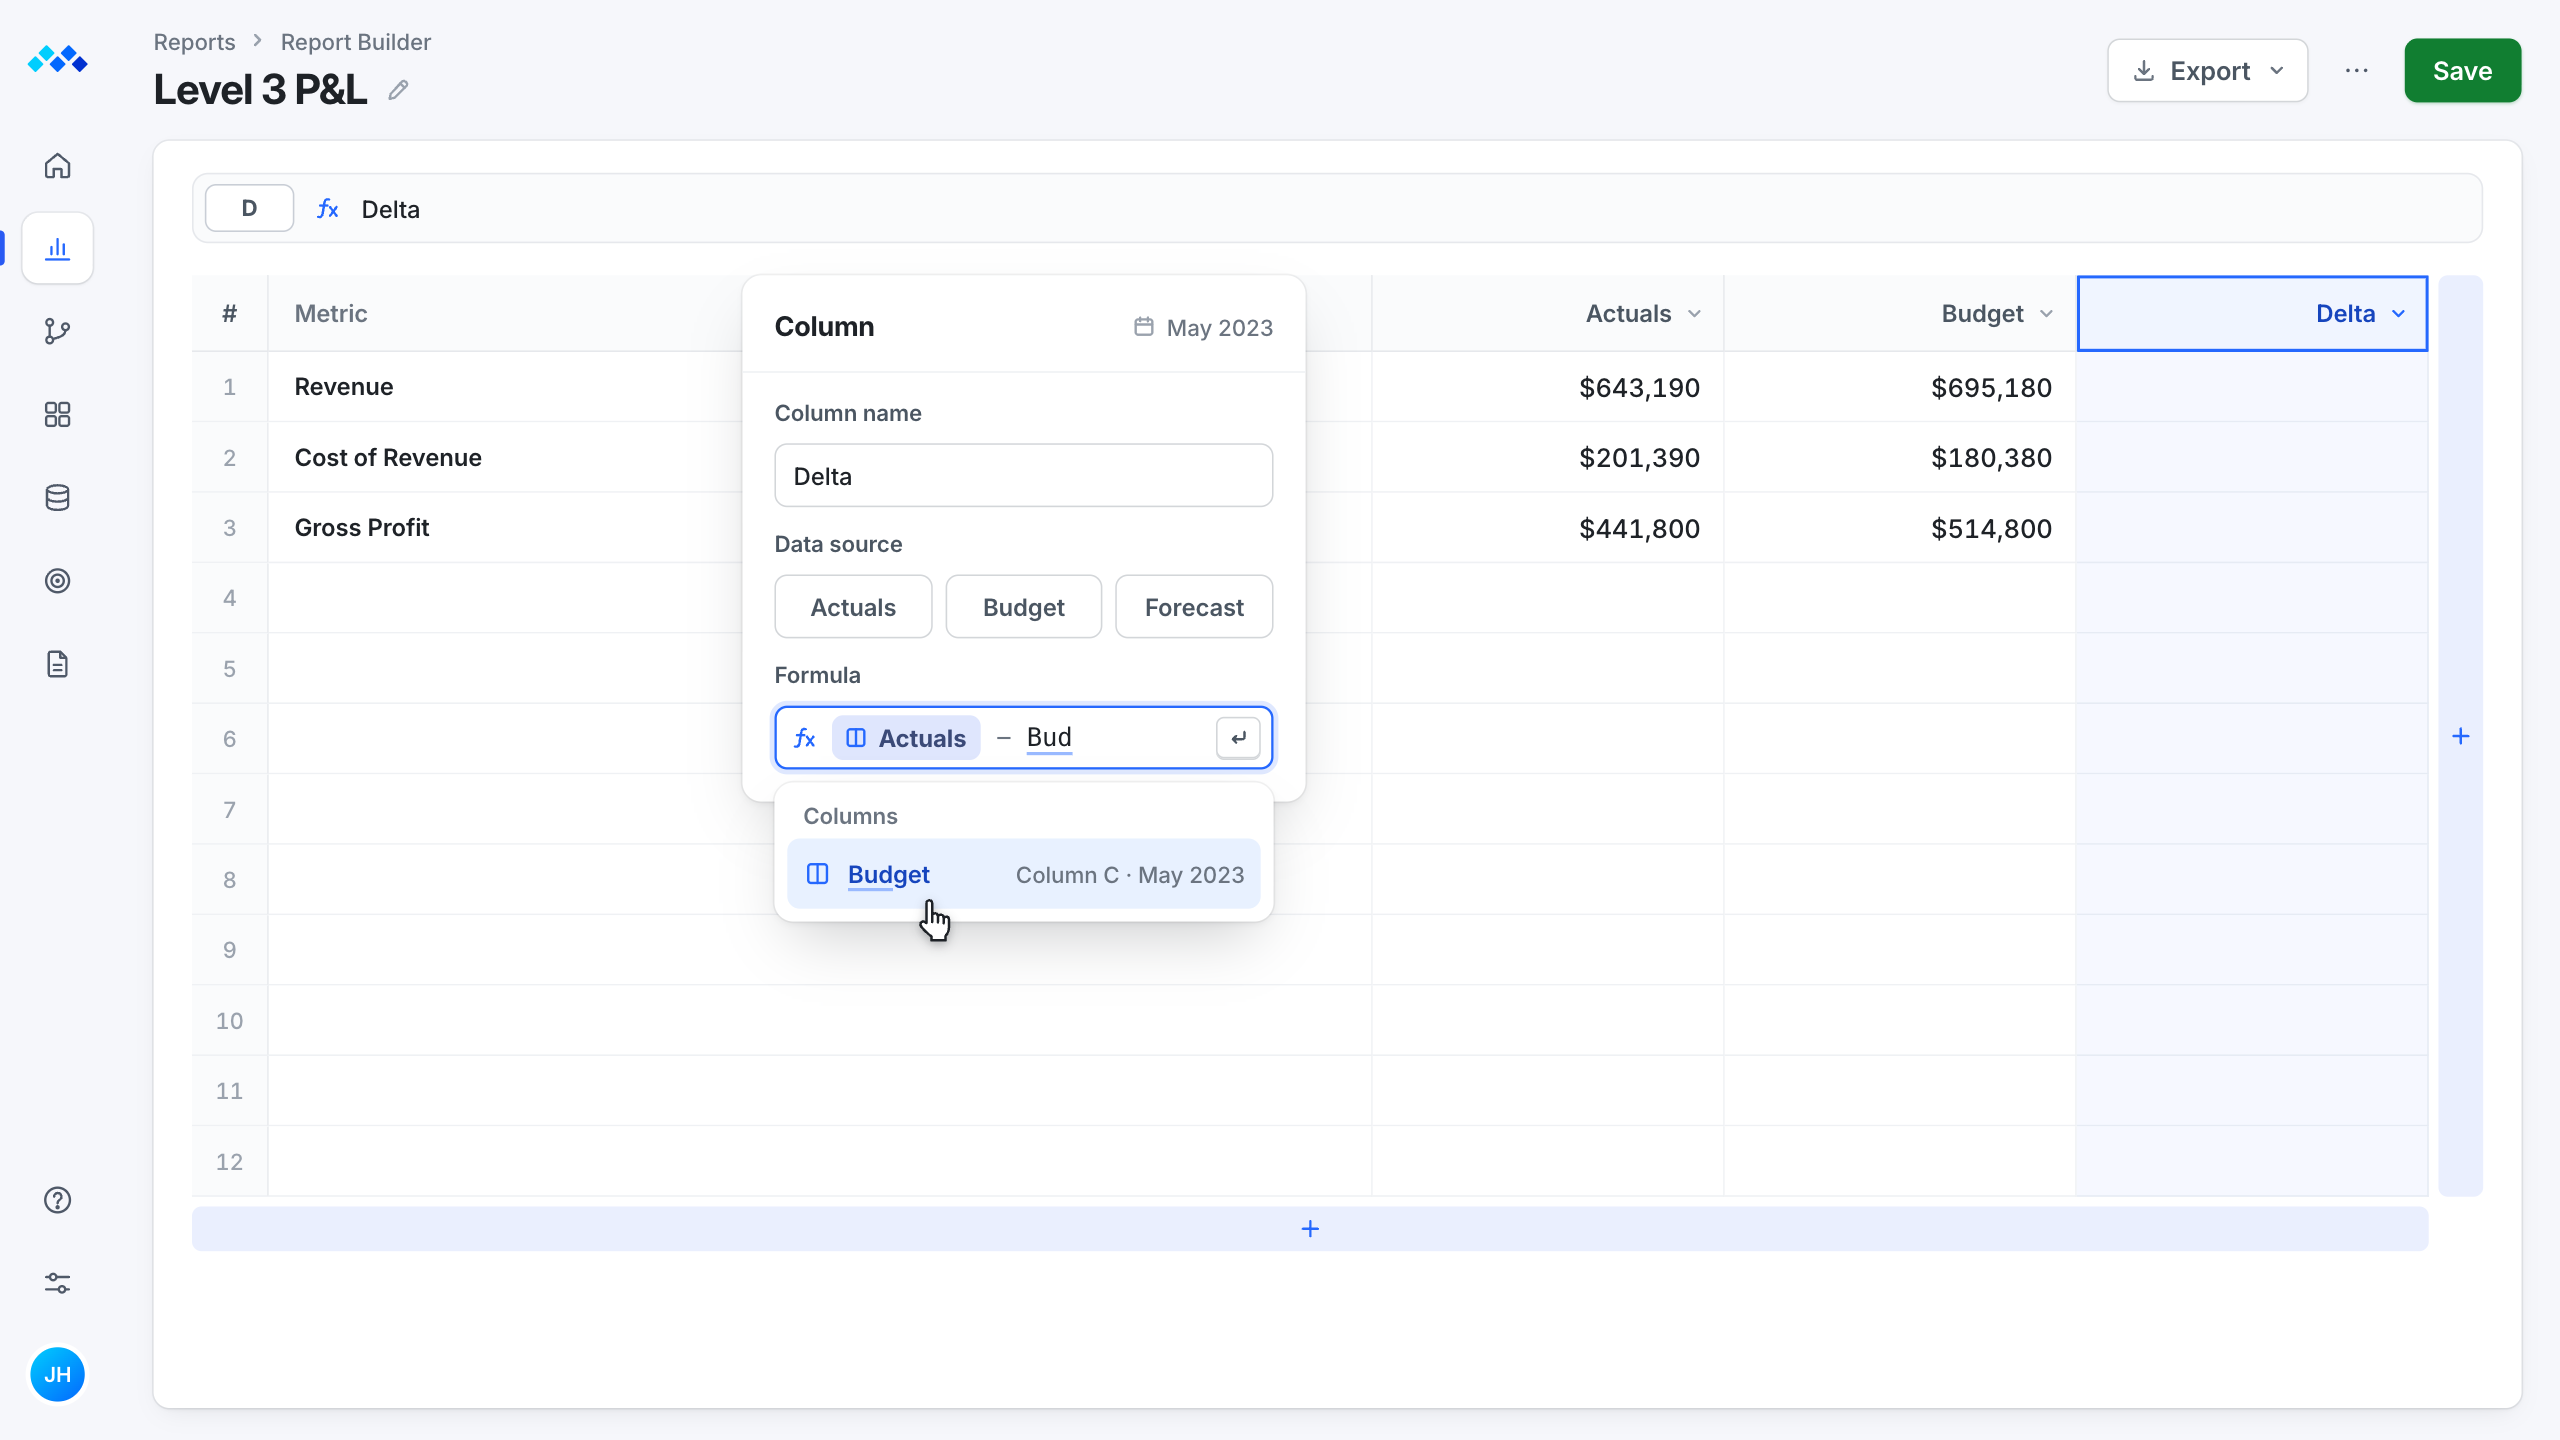
Name a column and type a formula like Actuals minus Budget in its header. With real-time data sync, the whole column fills when you press Enter. Column names come up as you type, and there is no Update step.
Animated mini of the report. A new column is added from the plus rail and named Delta. Its formula is typed in the header's formula field, with column names suggested as you type: Actuals minus Budget. The column then fills at once: minus $51,990 for Revenue, $21,010 for Cost of Revenue and minus $73,000 for Gross Profit.
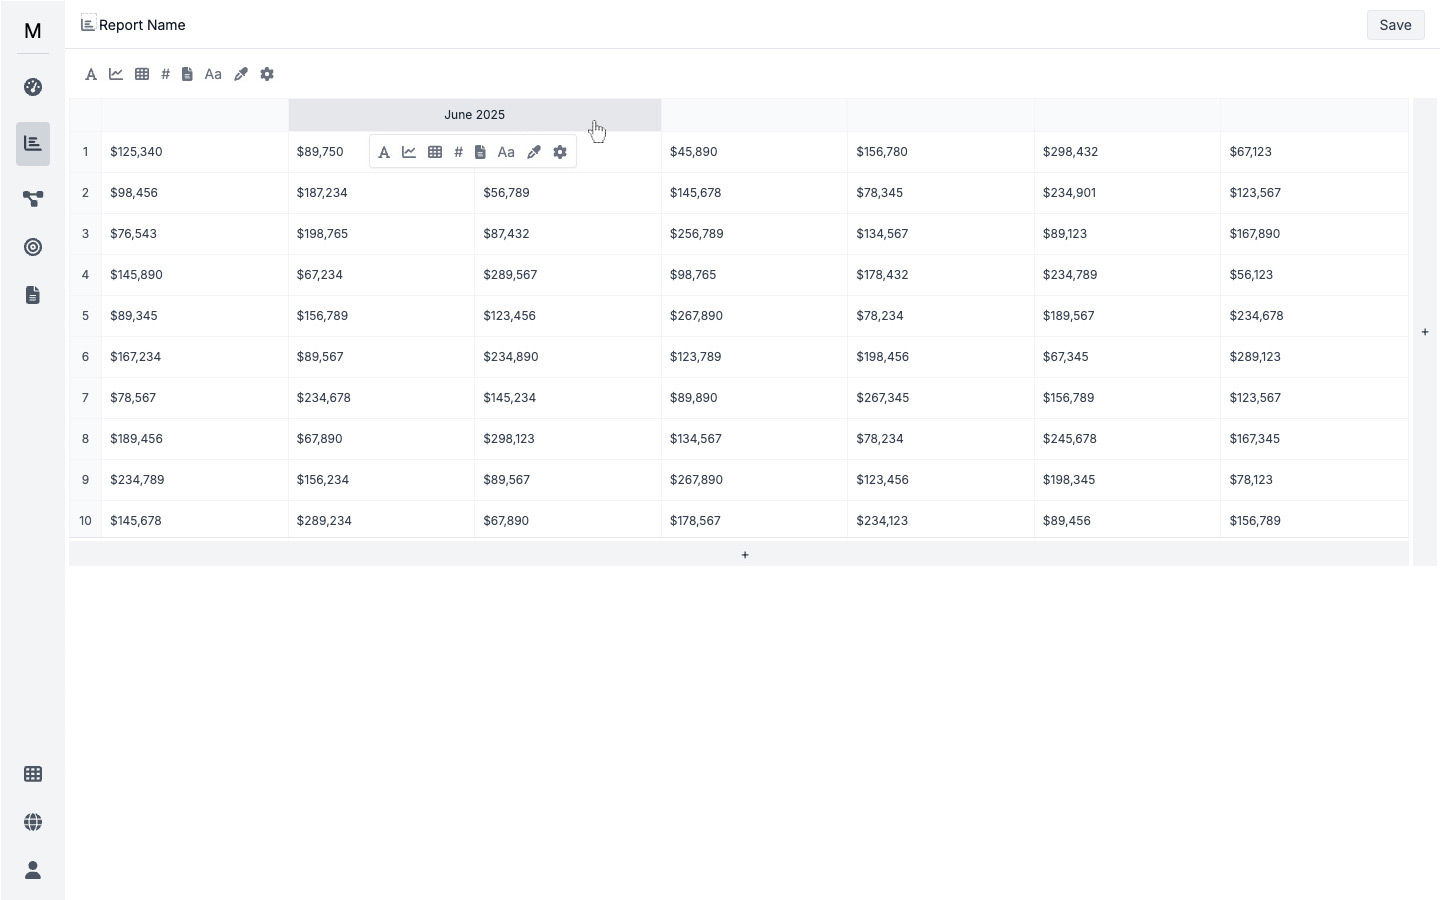
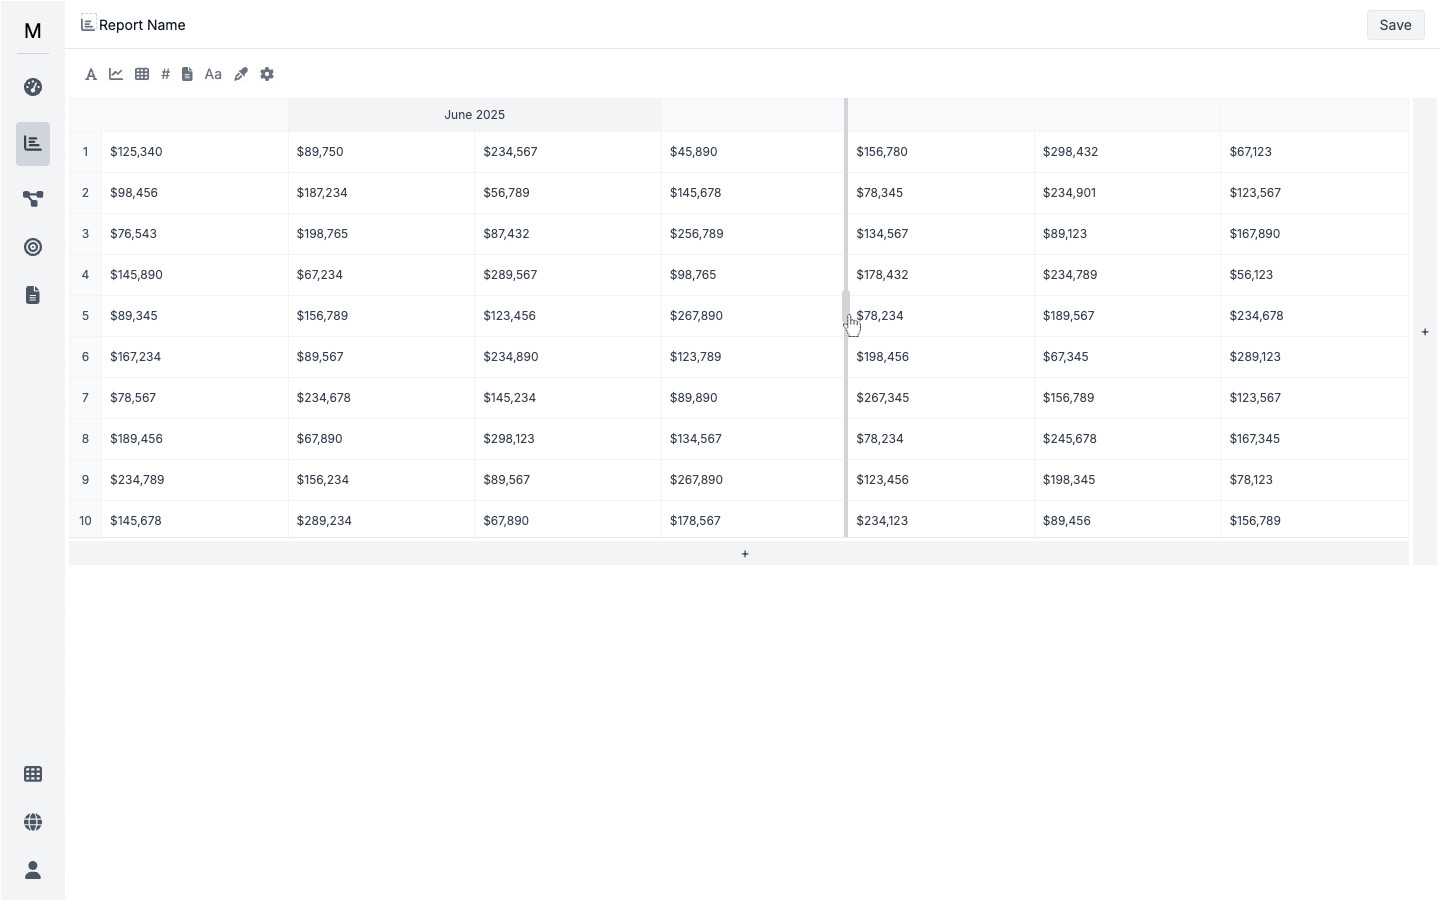
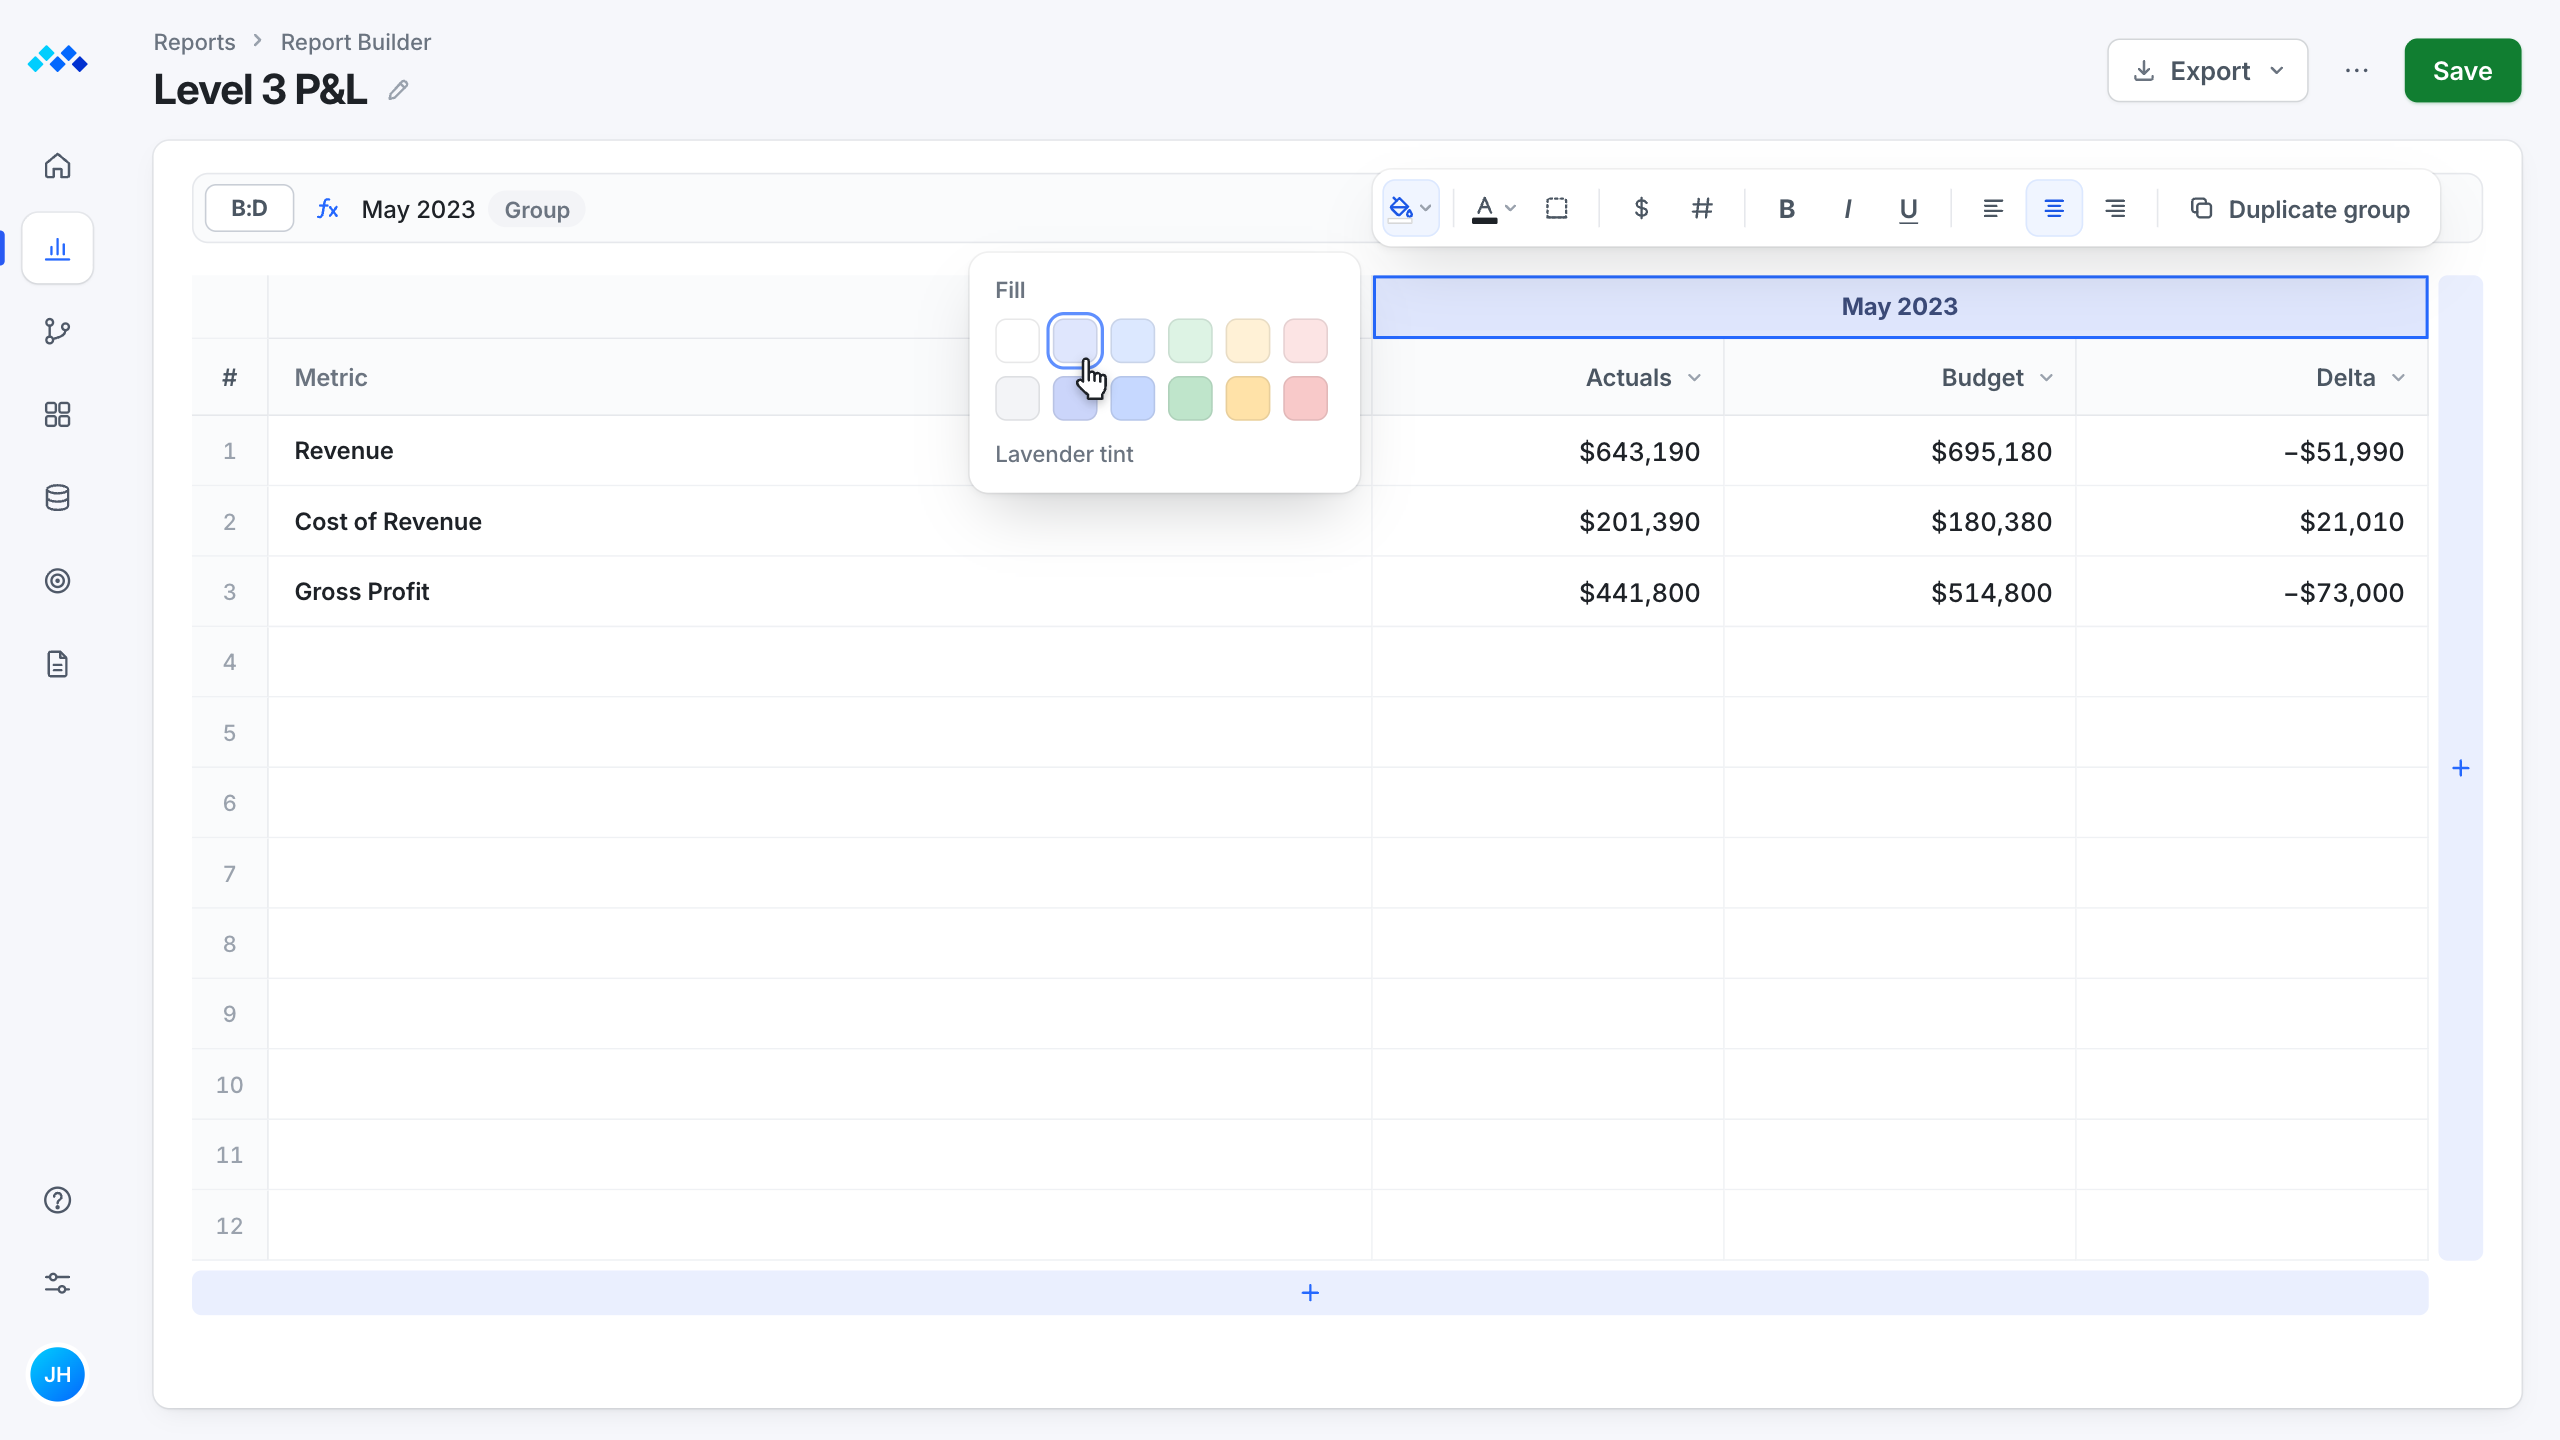
Inline styling came from the experienced modeler. Select a few headers, group them under a name like May 2023, then click the band and pick a fill from the format toolbar.
Shaped byThe Experienced Modeler
Animated mini of the report. The Actuals, Budget and Delta headers are selected together and grouped from the header menu. A band named May 2023 forms over the three columns. Clicking it opens the format toolbar, and a lavender fill is applied in place.
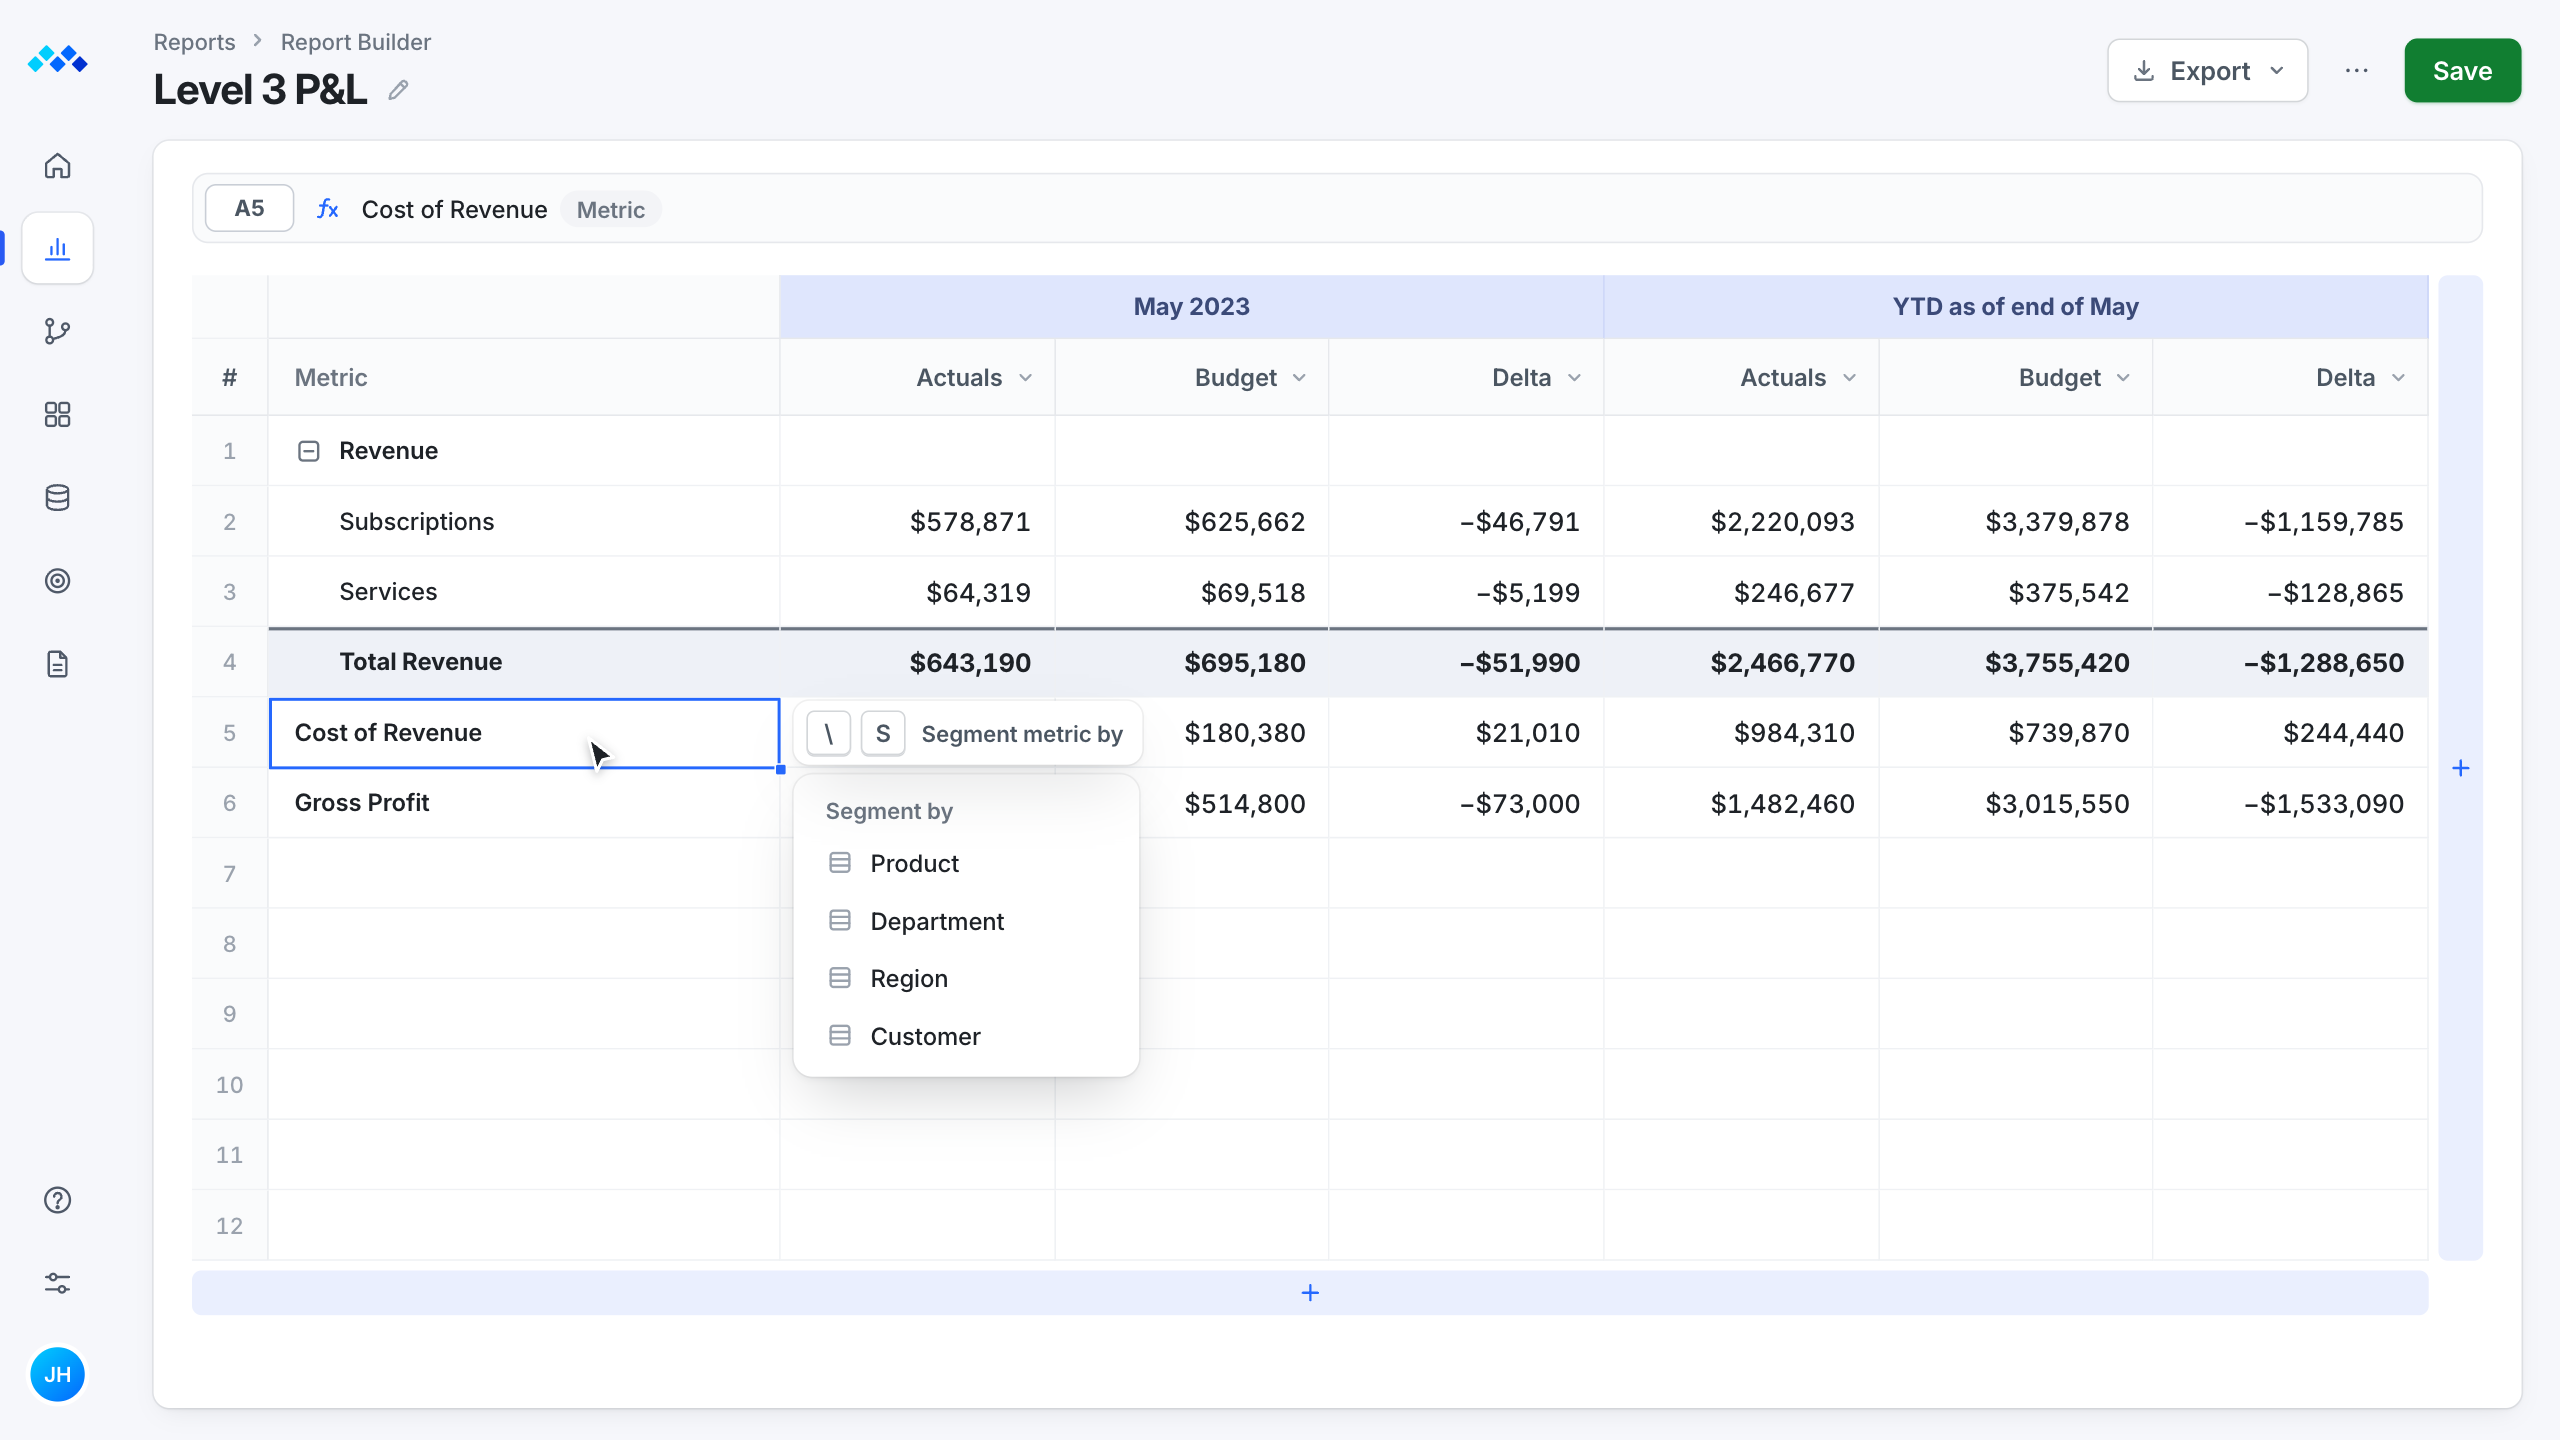
Open a row's menu and choose Segment metric by. Revenue opens into Subscriptions, Services and a Total Revenue row, and the rest of the report stays put.
Animated mini of the report. Revenue's row menu offers Segment metric by, and picking Product keeps Revenue as a header and opens it into Subscriptions ($578,871 actual, $625,662 budget), Services ($64,319 and $69,518) and a bold Total Revenue row ($643,190 and $695,180). Cost of Revenue and Gross Profit move down and stay as they were.
Testing
In each round I worked on slow menu navigation and data lag.
Product tour
The four features run in the order you'd use them to build a P&L.
Try it
Start from a simple P&L and end with a saved report, all inside the sheet.
Step 1 of 4
Add a Budget column
Put the plan next to what happened in May 2023.
| Metric | Actuals |
|---|---|
| Revenue | $643,190 |
| Cost of Revenue | $201,390 |
| Gross Profit | $441,800 |
Results
Report creation grew across Mosaic, with user engagement up 25%.
Result
About35%less report setup time
Finance teams build reports faster.
Result
ExportsBetterstyled andeasier to share
Teams shared just the data they chose, in PDF or CSV.
Result
In feedbackAheadof Excel and Sheetson efficiency
Participants praised its speed, customization and exports.
25%more userengagement
A sign of wider use among FP&A professionals.
Looking back
Early talks shaped the design, but only 3 to 4 people tested it.
Those talks shaped inline edits, quick customization and exports, and made building a report smoother than the old rigid setup.
More early prototyping with a wider range of users would have helped me polish inline styling further.
Custom Reports · Mosaic
I took editing out of the side panel and put it in the report, so planners and modelers build the same report without an Update step.